
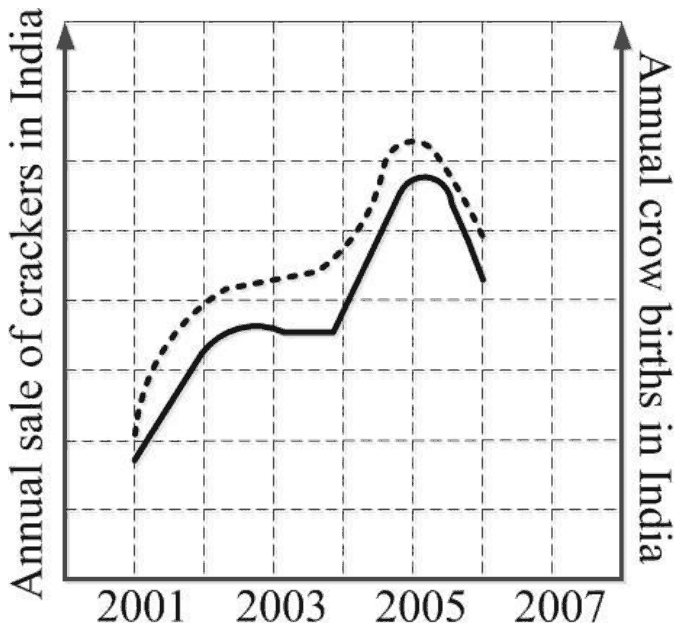
In a detailed study of annual crow births in India, it was found that there was relatively no growth during the period 2002 to 2004 and a sudden spike from 2004 to 2005. In another unrelated study, it was found that the revenue from cracker sales in India which remained fairly flat from 2002 to 2004, saw a sudden spike in 2005 before declining again in 2006. The solid line in the graph below refers to annual sale of crackers and the dashed line refers to the annual crow births in India. Choose the most appropriate inference from the above data.
GATE Physics - 2018,
Answer: A
The appropriate inference is there is a strong correlation between crow birth and cracker sales.
The two curves rise, flatten, spike and fall together over the same years, so the data show a strong correlation: the two quantities move together. That is all the data can show, because the studies were unrelated and nothing links the two mechanisms.
The other three options all claim causation, in one direction or the other: that cracker use raises crow births, that falling cracker sales would lower crow births, or that more crow births raise cracker sales. Correlation alone does not establish causation; the two series could share a cause, or coincide by chance.
Please log in or register to report this question.