
Machine-translated by Google. Questions are authored in English.
Top

Data Interpretation Questions and Answers

Important Instructions
31.

Study the given graph and answer the following question.

Production of rice by states A, B and C during 2018 to 2020 (in lakh tonnes)

State201820192020
A450500600
B550470650
C620600720

The average production of rice (per year) by states A, B and C in 2018 is what percentage less than the production of rice by state C in 2020?

Exam Year(s)

DSSSB TGT - 2023,

Answer: C

The average production is 25% less than C's 2020 production. State production in 2018: A 450, B 550, C 620, so the average is \[ \frac{450 + 550 + 620}{3} = \frac{1620}{3} = 540 \] State C in 2020 produced 720 lakh tonnes. \[ \begin{aligned} \frac{720 - 540}{720}\times 100 &= \frac{180}{720}\times 100 \\ &= 25\% \end{aligned} \] Dividing the same difference of 180 by 540 instead of 720 would give \(33\frac{1}{3}\)%, which is the wrong base, since the question compares with C's 2020 production; 18% and 20% do not come out of these numbers.

Please log in or register to report this question.
32.

Consider the percentage of students of different schools involved in various activities.

School→
Activities↓
SSBSCSDS
Games25302023
Music15252520
Academic30202515
Dance25152230

The difference in average number of students in various activities of CS and the average number of students in dance is ________.

Exam Year(s)

DSSSB PGT - 2023,

Answer: A

The difference is 0. For CS, the average over the four activities is (20 + 25 + 25 + 22) / 4 = 92 / 4 = 23. For dance, the average over the four schools is (25 + 15 + 22 + 30) / 4 = 92 / 4 = 23. The difference is 23 - 23 = 0.

2, 3 and 5 would result only from misreading a cell in the table.

Please log in or register to report this question.

Direction for [ Question No: 33 To 33 ] :

Directions (Q19-Q20): Study the following graph carefully and answer the questions given below:

Total Number of Students Appeared and Qualified from Various Schools at a Scholarship Exam.

SchoolAppearedQualified
A32502000
B20001250
C30002000
D25001500
E27502000

33.

Find the difference between appeared and qualified number of students from school B.

Exam Year(s)

DSSSB - 2023,

Answer: B

The difference for school B is 750. From the data the number of students from school B who appeared is 2000 and the number who qualified is 1250. \[ 2000 - 1250 = 750 \] The values 650, 850 and 950 do not match the difference; 650 and 850 are close to it, but they are not the figures of the bars of school B.

Please log in or register to report this question.

Direction for [ Question No: 34 To 34 ] :

The number of candidates who appeared, qualified, and were chosen in a competitive examination from five districts of West Bengal, Nadia, Howrah, Burdwan, Hooghly and Bankura between the years of 2010 and 2014 are shown in the given table.

YearNadiaHowrahBurdwanHooghlyBankura
AppQualSelAppQualSelAppQualSelAppQualSelAppQualSel
2010800085094780081082750072078820068085640070075
2011480050048750080065560062085680060070710065075
2012750064082740056070480040048650052565520035055
2013950085090880092086700065070780072084640054060
2014900080070720085075850095080570048560450060075

34.

In 2012, what was the approximate percentage of the total number of candidates selected to the total number of candidates qualified for all five districts?

Exam Year(s)

DSSSB PGT - 2023,

Answer: A

The answer is about 13 per cent. For 2012 add the candidates selected in the five districts: 82 + 70 + 48 + 65 + 55 = 320. Add those who qualified: 640 + 560 + 400 + 525 + 350 = 2475. The required percentage is \[\frac{320}{2475} \times 100 \approx 12.9\] which is about 13 per cent. The options 10, 8 and 15 per cent are further from 12.9. The table was read from the page image, where the 2014 Bankura appeared figure reads 4500.

Please log in or register to report this question.

Direction for [ Question No: 35 To 35 ] :

The following table shows the production of minerals for some years as given. Production (in thousand tonnes)

YearAluminiumLeadNickelCopperMicaZincIron-ore
1990-912004822622256941100
1991-9224811223231068981120
1992-93306160238298601081122
1993-9436412624828876961132
1994-95410188246314841141116
1995-965602082783281001121124
1996-97620234368372921201142

35.

Which mineral had a continuous decrease in production over the given years from 1991-92 to 1993-94?

Exam Year(s)

DSSSB PGT - 2023,

Answer: B

Copper is the mineral whose production decreased continuously from 1991-92 to 1993-94. Its production was 310, 298 and 288 thousand tonnes in the three years, so it fell in each year.

Lead was 112, 160 and 126, so it rose in 1992-93 and then fell. Nickel was 232, 238 and 248, so it rose every year. Zinc was 98, 108 and 96, so it rose and then fell. A continuous decrease needs a fall at both steps, and only copper has that.

Please log in or register to report this question.

Direction for [ Question No: 36 To 36 ] :

Study the given table and answer the questions that follow.

The table represents the number of candidates appeared, qualified, and selected in a national level examination from four different schools M, N, O and P over the years 2012 to 2017.

Where A: Appeared; Q: Qualified ; S: Selected

YearMNOP
AQSAQSAQSAQS
2012700075084300040034200025027150016023
2013550050055350042056250034036250029056
2014650045542380046066350038048270048067
2015850085489450048572450056057340054087
2016900092292469067886567066068370065089
2017920094294670070092678068089450067093

36.

In the year 2017, which school had the highest percentage of candidates selected over the candidates appeared?

Exam Year(s)

DSSSB - 2023,

Answer: D

School P had the highest percentage.

In 2017 the selected-to-appeared percentages are: M 94/9200 = 1.02%, N 92/6700 = 1.37%, O 89/6780 = 1.31% and P 93/4500 = 2.07%.

P is the highest. M, N and O are all below 1.4%.

The question asks for the percentage selected out of those who appeared, not the percentage who qualified. P has the smallest number of candidates appearing (4500) and a high number selected (93), which makes its ratio the highest. A common mistake is to pick M, which has the largest number selected, 94.

Please log in or register to report this question.

37.

The pie chart presents the percentage contribution of different macronutrients to a typical 2,000 kcal diet of a person.

Macronutrient energy contribution (pie chart): Carbohydrates 35%, Proteins 20%, Unsaturated fat 20%, Saturated fat 20%, Trans fat 5%.

The typical energy density (kcal/g) of these macronutrients is given in the table.

MacronutrientEnergy density (kcal/g)
Carbohydrates4
Proteins4
Unsaturated fat9
Saturated fat9
Trans fat9

The total fat (all three types), in grams, this person consumes is

Exam Year(s)

GATE CS - 2024, GATE AE - 2024, GATE AG - 2024,

Answer: C

The person eats 100 g of fat.

The three fats together supply 20% + 20% + 5% = 45% of the 2,000 kcal, and every fat gives 9 kcal per gram:

\[ \begin{aligned} \text{Fat energy} &= 0.45 \times 2000 = 900\ \text{kcal} \\ \text{Fat mass} &= 900 / 9 = 100\ \text{g} \end{aligned} \]

44.4 g is the saturated (or unsaturated) fat alone, \(400/9\). 77.8 g is \(700/9\), which uses the 35% carbohydrate share by mistake. 3,600 multiplies the fat energy by 4 instead of dividing by 9.

Please log in or register to report this question.

38.

A 4 × 4 digital image has pixel intensities (\(U\)) as shown in the figure. The number of pixels with \(U \le 4\) is:

0102
4733
5544
6732

Exam Year(s)

GATE Chemistry - 2025, GATE AE - 2025,

Answer: C

There are 11 pixels with \(U \le 4\).

Count row by row the entries that are 4 or less:

  • Row 1 (0, 1, 0, 2): all 4
  • Row 2 (4, 7, 3, 3): 4, 3, 3, that is 3
  • Row 3 (5, 5, 4, 4): the two 4s, that is 2
  • Row 4 (6, 7, 3, 2): 3 and 2, that is 2

The total is 4 + 3 + 2 + 2 = 11. Counting only values strictly below 4 drops the three 4s and gives 8, which is the trap in option B. 9 and 3 miss further entries.

Please log in or register to report this question.

39.

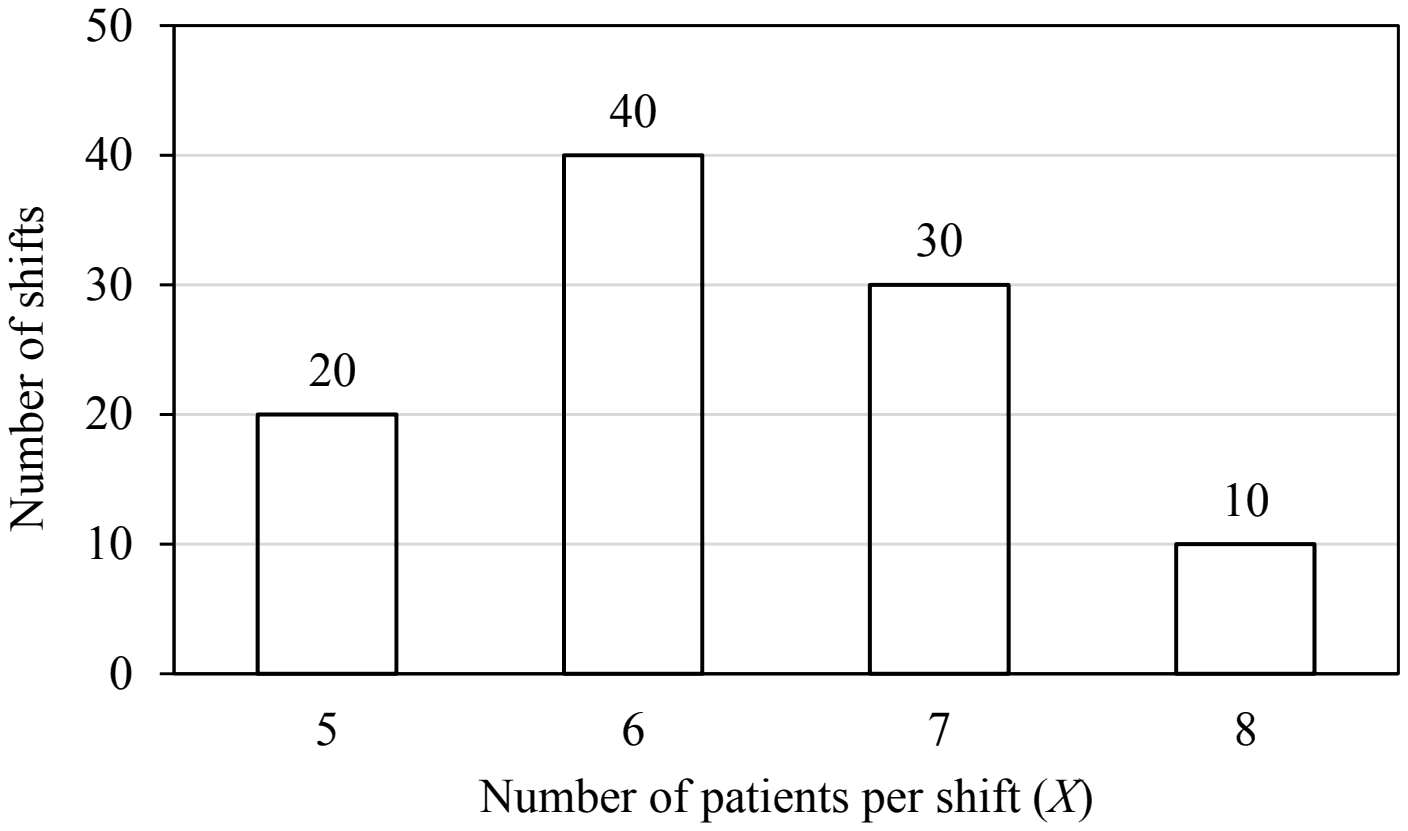
The number of patients per shift (\(X\)) consulting Dr. Gita in her past 100 shifts is shown in the figure. If the amount she earns is ₹ 1000(\(X - 0.2\)), what is the average amount (in ₹) she has earned per shift in the past 100 shifts?

Note: The figure shown is representative.

Bar chart of number of shifts against number of patients per shift X: 20 shifts at X=5, 40 shifts at X=6, 30 shifts at X=7, 10 shifts at X=8

Exam Year(s)

GATE AE - 2025,

Answer: A

She earned ₹ 6,100 per shift on average.

The mean number of patients per shift, weighted by the number of shifts, is

\[ \begin{aligned} \bar{X} &= \frac{5(20) + 6(40) + 7(30) + 8(10)}{100} \\ &= \frac{100 + 240 + 210 + 80}{100} = 6.3 \end{aligned} \]

The earning is linear in X, so the average earning is \(1000(\bar{X} - 0.2) = 1000(6.1) = 6100\) rupees. 6,300 is the mean number of patients times 1000, forgetting to subtract the 0.2 per shift. Because the earning rule is linear, averaging X first and averaging the earnings shift by shift give the same 6,100.

Please log in or register to report this question.

40.

Two finance companies, P and Q, declared fixed annual rates of interest on the amounts invested with them. The rates of interest offered by these companies may differ from year to year. Year-wise annual rates of interest offered by these companies are shown by the line graph provided below.

YearPQ
200076.5
200198
200289.5
2003108
20047.59
20056.58
200664

If the amounts invested in the companies, P and Q, in 2006 are in the ratio 8:9, then the amounts received after one year as interests from companies P and Q would be in the ratio:

Exam Year(s)

GATE AG - 2016,

Answer: D

The interest is in the ratio 4:3.

In 2006 the graph gives P's rate as 6% and Q's as 4%. Interest is amount times rate, so with amounts in the ratio 8:9:

\[ \begin{aligned} \frac{I_{P}}{I_{Q}} &= \frac{8 \times 6}{9 \times 4} \\ &= \frac{48}{36} = \frac{4}{3} \end{aligned} \]

P earns more despite the smaller deposit because its rate is one and a half times Q's. The ratios 2:3, 3:4 and 6:7 all put Q ahead, which would need Q's rate to be the higher one, as it was in 2002, 2004 and 2005 but not in 2006.

Please log in or register to report this question.

Loading…
Tags: Data Interpretation Questions and Answers || DI MCQ Questions || Data Analysis Quantitative Aptitude || Data Interpretation GK Questions || DI on Quantitative Aptitude