
Machine-translated by Google. Questions are authored in English.
Top

Data Interpretation Questions and Answers

Important Instructions
61.

Following table provides the data regarding the people who are seeking asylum in different countries. Asylum seekers: Share of top 15 receiving countries in total number of applications

All the data given in the table below are in percentages. For example, in 2007, USA received 15% applications out of total asylum seekers applications.

Countries: 2007 2008 2009 2010 2011
USA: 15 13 13 15 17
France: 9 9 11 13 12
Germany: 6 6 7 11 10
Italy: 4 8 5 3 8
Sweden: 11 6 6 9 7
Belgium: 3 3 5 6 6
UK: 8 8 8 6 6
Canada: 8 10 9 6 6
Switzerland: 3 4 4 4 4
Turkey: 2 3 2 3 4
Austria: 4 3 4 3 3
Netherlands: 2 4 4 4 3
Australia: 1 1 2 3 3
Greece: 8 5 4 3 2
Norway: 2 4 5 3 2

USA received 72800 applications in the year 2010. Then the total number of asylum seekers who didn't apply to any to the countries mentioned in the table (approximately) are:

Exam Year(s)

HPPSC HPAS - 2021,

Answer: C

About 38800 asylum seekers applied to countries outside the table.

In 2010 the USA's 72800 applications were 15% of all applications, which gives the total.

\[ \begin{aligned} \text{total} &= \frac{72800}{0.15} \approx 485333 \\ \text{table, 2010} &= 92\% \\ \text{others} &= 8\% \times 485333 \approx 38827 \end{aligned} \]

The 92% is the sum of the fifteen countries' 2010 column (15 + 13 + 11 + 3 + 9 + 6 + 6 + 6 + 4 + 3 + 3 + 4 + 3 + 3 + 3). The remaining 8% is about 38827, which rounds to 38800. 36400 would be 7.5% of the total, and 37800 and 40200 match no share that the table supports.

Please log in or register to report this question.
62.

Following pie chart provide the percentage compositions of students from a state enrolled in different faculty in 2001 and 2002 whereas bar chart provides total number of students between the years 2001-2004.

FacultyYear 2001Year 2002
Pharmacy7%9%
Agriculture8%5%
Science16%22%
Commerce24%24%
Engineering20%19%
Arts13%11%
Medicine12%10%

Following bar chart provides the total number of students from that particular state across four years - 2001 to 2004.

2001: 35000
2002: 40000
2003: 43000
2004: 48000

In which faculty there was decrease in the number of students from 2001 to 2002?

Exam Year(s)

HPPSC HPAS - 2021,

Answer: C

The number of students fell in Agriculture.

The bar chart gives about 35000 students in 2001 and 40000 in 2002. Multiply each year's total by the faculty's share.

\[ \begin{aligned} \text{Agri. 2001} &= 8\% \times 35000 = 2800 \\ \text{Agri. 2002} &= 5\% \times 40000 = 2000 \end{aligned} \]

Agriculture fell by 800 students. The other two named faculties grew: Commerce went from \(24\% \times 35000 = 8400\) to \(24\% \times 40000 = 9600\), and Pharmacy from 2450 to 3600. 'None' is wrong because a falling share can mean a falling number even when the total rises, as it does for Agriculture.

Please log in or register to report this question.

63.

A pie chart gives the expenditure on 5 different items A, B, C, D, E in a household. If B, C, D, E correspond to 65°, 45°, 90°, 100° respectively, then what is the percentage of expenditure on item A?

Exam Year(s)

Haryana Civil Services - 2026, HPSC - 2026,

Answer: B

Item A accounts for 50/3 % of the expenditure, that is \(16\tfrac{2}{3}\)%.

The angles in a pie chart add to 360°.

\[ \begin{aligned} A &= 360 - (65 + 45 + 90 + 100) = 60^\circ \\ \frac{60}{360} \times 100 &= \frac{50}{3}\% \end{aligned} \]

25 is what you get by dividing 60 by 240 instead of 360, and 175/6 and 25/18 do not correspond to 60° of a 360° circle. A sixth of the circle is always \(16\tfrac{2}{3}\)%, a value worth remembering.

Please log in or register to report this question.

64.

The monthly expenditure of a family is represented in a pie chart. The central angle for Food is 108° and for Education is 54°. Consider the following pairs:

1.Percentage expenditure on Food30%
2.Ratio of Food to Education expenditure2 : 1
3.Total percentage of remaining sectors60%

How many of the above pairs are correctly matched?

Exam Year(s)

Haryana Civil Services - 2026, HPSC - 2026,

Answer: B

Only two pairs are correctly matched.

Convert each angle to a share of 360°.

\[ \begin{aligned} \text{Food} &= \tfrac{108}{360} \times 100 = 30\% \\ \text{Education} &= \tfrac{54}{360} \times 100 = 15\% \end{aligned} \]

Pair 1 (30%) is right. Pair 2 is right: 108 : 54 = 2 : 1. Pair 3 is wrong: the remaining sectors are \(100 - 30 - 15 = 55\%\), not 60%. 60% would need Education to be 10%, that is 36°, not 54°.

Please log in or register to report this question.

65.

Consider the following bar graph which represents the grade of the students:

GradeNumberf of Students
Withdrew8
F4
D8
C6
B19
A3
1.Number of students who withdrew = 8Number of students having grade D = 8Number of students having grade A = 4
2.Number of students who withdrew = 8Number of students having grade D = 8Number of students having grade A = 3
3.Number of students who withdrew = 8Number of students having grade C = 8Number of students having grade A = 3

In how many of the above rows is the given information correctly tabulated?

Exam Year(s)

Haryana Civil Services - 2026, HPSC - 2026,

Answer: A

The information is correct in only one row.

Reading the bars: Withdrew 8, F 4, D 8, C 6, B 19 and A 3.

  • Row 1 gives grade A as 4; the bar is 3 (4 is the F bar). Wrong.
  • Row 2: withdrew 8, grade D 8, grade A 3. All correct.
  • Row 3 gives grade C as 8; the bar is 6. Wrong.

So only row 2 is fully correct. Each wrong row changes one value, which is why every entry, not just the first, has to be checked.

Please log in or register to report this question.

66.

Following is the record of the performance of a football team for the seven tournaments played in a year

TournamentMatches wonMatch LostTotal matches played
1538
2448
3527
4639
5426
6336
7246

What percent of the matches did the team win overall?

Exam Year(s)

ISRO Assistant - 2023,

Answer: A

The team won 58% of its matches.

Add the matches won and the total played across the seven tournaments:

\[ \begin{aligned} \text{won} &= 5+4+5+6+4+3+2 = 29 \\ \text{played} &= 8+8+7+9+6+6+6 = 50 \end{aligned} \]

\(29/50 = 58\%\). Averaging the seven separate win percentages would give a slightly different figure, because the tournaments have different numbers of matches. 52%, 75% and 80% do not match the totals.

Please log in or register to report this question.

67.

The following Pie chart represents the vehicles used by office goers to reach their office.

Vehicles
Walk20
Car100
Bus80
Bike120

What is the central angle corresponding to the office goers who use four-wheelers for their commute ?

Exam Year(s)

Kerala PSC KAS - 2025,

Answer: A

The central angle is 202.5°.

The chart totals \(20 + 100 + 80 + 120 = 320\) office goers. The four-wheelers are cars and buses, \(100 + 80 = 180\) people.

\[ \begin{aligned} \text{angle} &= \frac{180}{320} \times 360^\circ \\ &= 202.5^\circ \end{aligned} \]

Counting only cars would give \(\frac{100}{320} \times 360^\circ = 112.5^\circ\), which is not an option, a sign that buses belong in the four-wheeler group. 203° to 204° are rounding traps around the exact value.

Please log in or register to report this question.

68.

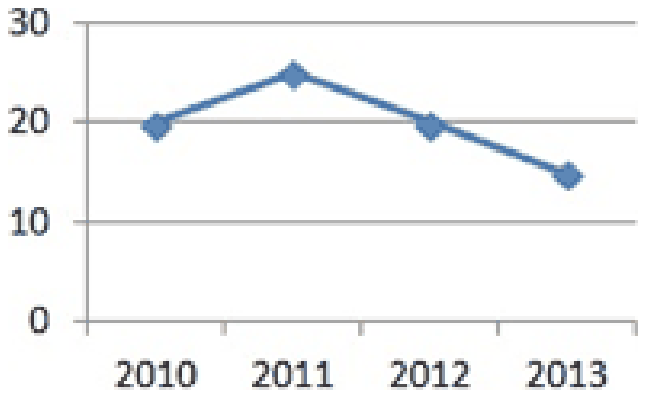
Salary (in thousands) of Deepak for the given period are shown in graph:-

Line graph of salary in thousands for 2010 to 2013, with points at about 20, 25, 20 and 15

By what percentage has Deepak’s salary decreased in 2013 over 2010?

Exam Year(s)

MP Lab Technician - 2015,

Answer: B

The salary fell by 25%.

Reading the graph, Deepak's salary was 20 thousand in 2010 and 15 thousand in 2013, a fall of 5 thousand.

\[ \begin{aligned} \text{decrease} &= \frac{20 - 15}{20} \times 100 \\ &= 25\% \end{aligned} \]

The base of a percentage change is the earlier value, 2010's 20 thousand.

33.33% is what you get by dividing the fall by the 2013 value, 15, instead of 20. 20% would be the fall from 2011 to 2012 (25 to 20). 'None of these' is wrong because 25% is offered.

Please log in or register to report this question.

Direction for [ Question No: 69 To 69 ] :

In the 2020 summer Olympics’ Javelin throw finals, Neeraj Chopra exhibited a spectacular performance to win the gold medal. The silver medal was won by Jakub Vadlejch and the bronze medal was won by Vitezlav Vesely. There were six rounds of throws with each athlete having one throw per round. The best of all the throws of each athlete is considered for the medal. Following were the observations about the throws:

i. The first and second rounds were dominated by Neeraj Chopra with a gold medal performance in his second throw, while the other two athletes did not have any medal winning throws in these rounds.
ii. The throws in the last round by both Jakub Vadlejch and Vitezlav Vesely were fouls and were not considered for scoring.
iii. After four rounds, Vitezlav Vesely was in the second position and could not improve upon his best throw in the succeeding rounds.
iv. In the fourth round, the throw by Jakub Vadlejch was the best in that round.

69.

In which round did Vitezlav Vesely have his best throw?

Exam Year(s)

GATE CS - 2026,

Answer: A

Vesely's best throw was in the third round.

  • From (i), neither Vadlejch nor Vesely made a medal-winning throw in rounds 1 and 2, so Vesely's best (his bronze-winning throw) came in round 3 or later.
  • From (iii), Vesely could not improve after round 4, so his best came no later than round 4. Round 6 is also ruled out by (ii), as it was a foul.
  • From (iv), Vadlejch's round 4 throw beat Vesely's round 4 throw. But after four rounds Vesely was ahead of Vadlejch, so Vesely's best must exceed Vadlejch's round 4 throw, and therefore cannot be his own round 4 throw.

That leaves round 3. Vadlejch, who finished second, must have produced his silver-winning throw in round 5, which is consistent with all four observations.

Please log in or register to report this question.

Direction for [ Question No: 70 To 70 ] :

Following table provides the data regarding the people who are seeking asylum in different countries. Asylum seekers: Share of top 15 receiving countries in total number of applications

All the data given in the table below are in percentages. For example, in 2007, USA received 15% applications out of total asylum seekers applications.

Countries: 2007 2008 2009 2010 2011
USA: 15 13 13 15 17
France: 9 9 11 13 12
Germany: 6 6 7 11 10
Italy: 4 8 5 3 8
Sweden: 11 6 6 9 7
Belgium: 3 3 5 6 6
UK: 8 8 8 6 6
Canada: 8 10 9 6 6
Switzerland: 3 4 4 4 4
Turkey: 2 3 2 3 4
Austria: 4 3 4 3 3
Netherlands: 2 4 4 4 3
Australia: 1 1 2 3 3
Greece: 8 5 4 3 2
Norway: 2 4 5 3 2

70.

The sum of percentage of applications received by the top three rank countries is more than the sum of percentage of applications received by the remaining countries in the table, in number of years:

Exam Year(s)

HPPSC HPAS - 2021,

Answer: D

The top three countries never out-weigh the rest, so the answer is None of these: it happens in 0 years.

Add up each year's column and take the three largest shares:

\[ \begin{aligned} 2007 &: \text{all } 86,\ \text{top three } 15 + 11 + 9 = 35 \\ 2008 &: \text{all } 87,\ \text{top three } 13 + 10 + 9 = 32 \\ 2009 &: \text{all } 89,\ \text{top three } 13 + 11 + 9 = 33 \\ 2010 &: \text{all } 92,\ \text{top three } 15 + 13 + 11 = 39 \\ 2011 &: \text{all } 93,\ \text{top three } 17 + 12 + 10 = 39 \end{aligned} \]

The remaining twelve countries hold 51, 55, 56, 53 and 54, which is more than the top three every year. So the number of years is zero, which is not offered as 1, 2 or 3.

Please log in or register to report this question.

Loading…
Tags: Data Interpretation Questions and Answers || DI MCQ Questions || Data Analysis Quantitative Aptitude || Data Interpretation GK Questions || DI on Quantitative Aptitude