
Discussion
Which one of the given figures P, Q, R and S represents the graph of the following function?
\[ f(x) = \big|\,|x+2| - |x-1|\,\big| \]
- A.
- B.
- C.
- D.

Answer: A
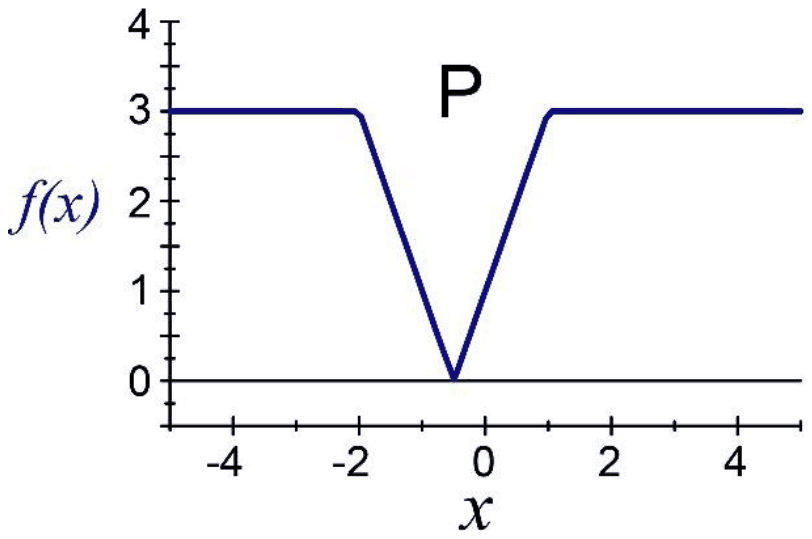
The graph is P.
Work out \(g(x) = |x+2| - |x-1|\) on the three intervals set by x = -2 and x = 1:
\[ \begin{aligned} x \le -2:&\quad g = -(x+2)+(x-1) = -3 \\ -2 \le x \le 1:&\quad g = (x+2)+(x-1) = 2x+1 \\ x \ge 1:&\quad g = (x+2)-(x-1) = 3 \end{aligned} \]
Taking the absolute value, f is 3 for x up to -2, falls along |2x + 1| to 0 at x = -1/2, rises back to 3 at x = 1, and stays at 3. That is graph P.
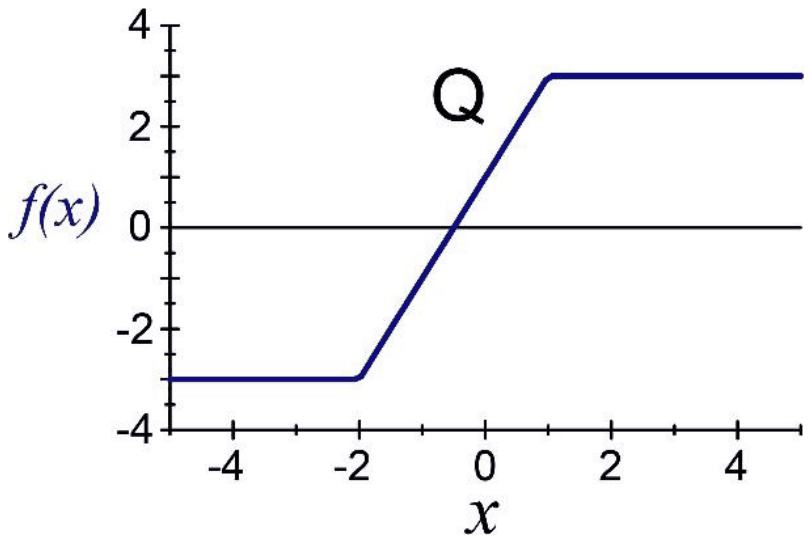
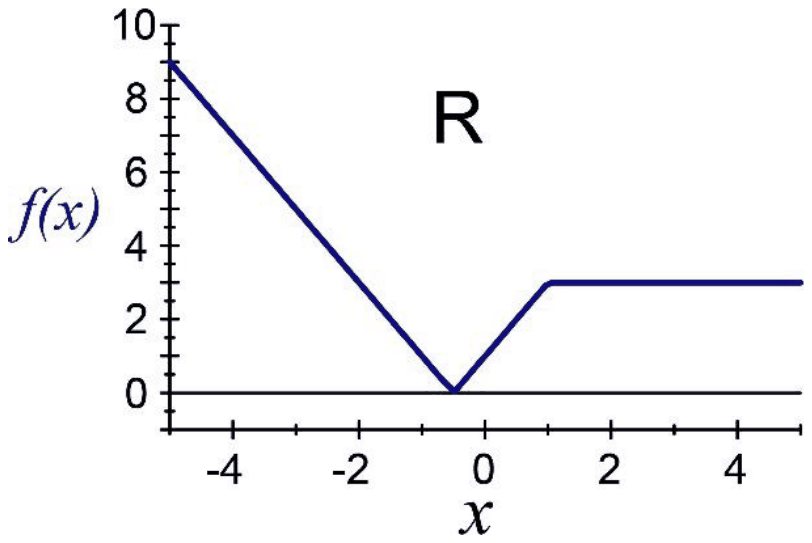
Q is the graph of g itself, without the outer absolute value. R and S rise without bound to the left, which f cannot do, since it never exceeds 3.
No comment is present. Be the first to comment.
Loading…
Post your comment
Please log in or register to post a comment.
Examination Categories
- SSC Exams
- Banking Exams
- Teaching Exams
- Civil Services Exams
- Railways Exams
- Engineering Recruitment Exams
- Defence Exams
- State Government Exams
- Police Exams
- Insurance Exams
- Nursing Exams
- Other Government Exams
- NRA CET
- PG Entrance Exams
- Campus Placement
- MBA Entrance Exams
- CUET and UG Entrance
- Judiciary Exams
- Regulatory Body Exams
- Software Development