
Discussion
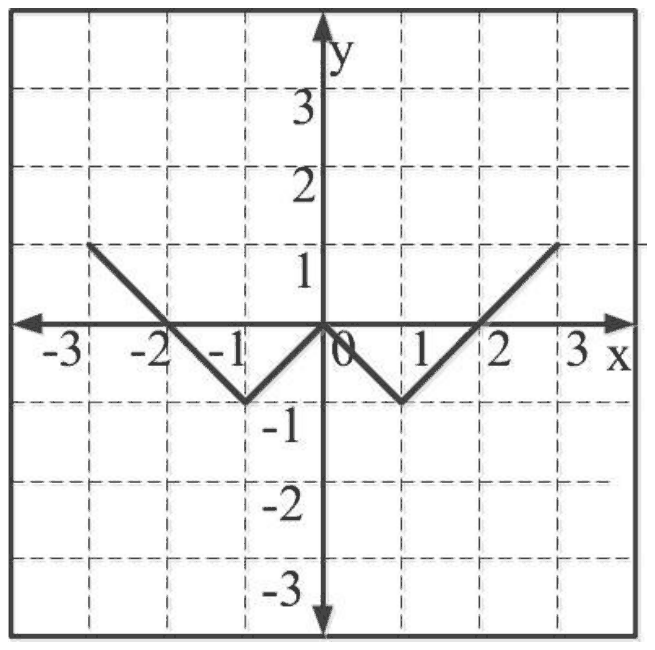
Which of the following functions describe the graph shown in the below figure?
Answer: B
The graph is \(y = ||x| - 1| - 1\).
Read values off the graph: y = 0 at x = 0, y = -1 at x = ±1, y = 0 at x = ±2 and y = 1 at x = ±3. For this function, \(x = 0\) gives \(|0 - 1| - 1 = 0\); \(x = \pm 1\) gives \(0 - 1 = -1\); \(x = \pm 2\) gives \(1 - 1 = 0\); \(x = \pm 3\) gives \(2 - 1 = 1\). Every point fits.
\(||x| + 1| - 2\) gives -1 at x = 0, and \(||x| + 1| - 1\) gives 0 at x = 0 but never goes negative, so neither has the two dips to -1. \(||x - 1| - 1|\) is never negative at all.
No comment is present. Be the first to comment.
Loading…
Post your comment
Please log in or register to post a comment.
Examination Categories
- SSC Exams
- Banking Exams
- Teaching Exams
- Civil Services Exams
- Railways Exams
- Engineering Recruitment Exams
- Defence Exams
- State Government Exams
- Police Exams
- Insurance Exams
- Nursing Exams
- Other Government Exams
- NRA CET
- PG Entrance Exams
- Campus Placement
- MBA Entrance Exams
- CUET and UG Entrance
- Judiciary Exams
- Regulatory Body Exams
- Software Development