
Discussion
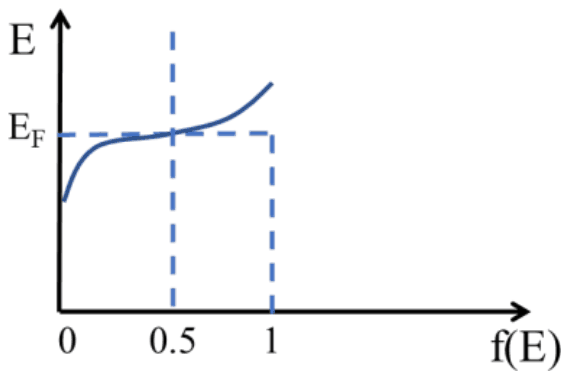
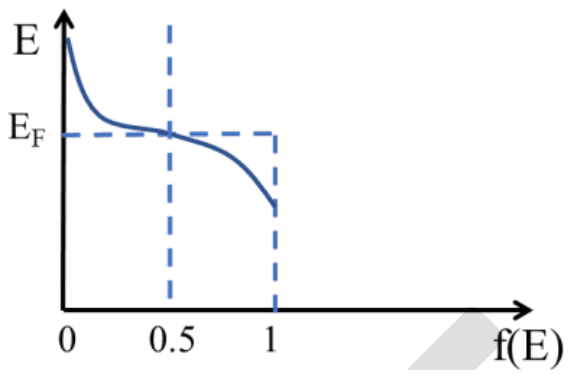
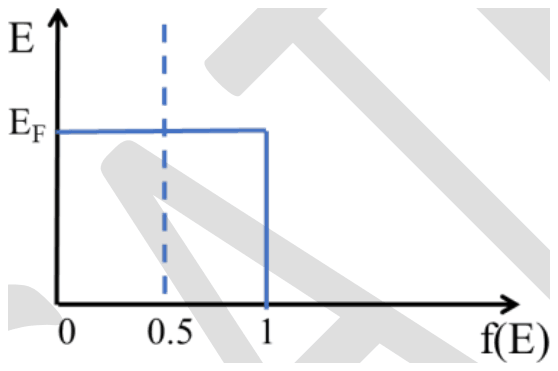
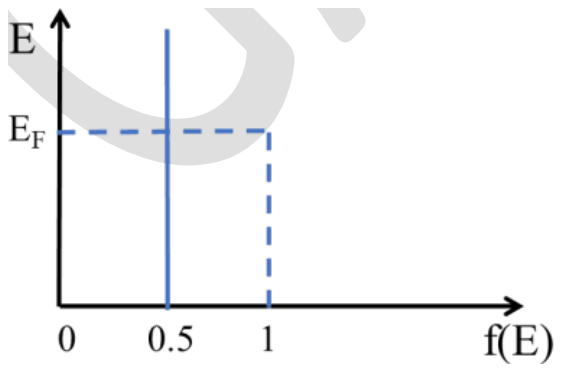
Which one of the following curves best represents the E vs. f(E) behavior of the hot end of a metal rod demonstrating Seebeck Effect? ( f(E) is the probability of electron occupancy at an energy state E ; EF is the Fermi energy)
- A.
- B.
- C.
- D.
Answer: B
The correct curve is (B).
Electron occupancy follows the Fermi-Dirac function \(f(E) = 1/(1 + e^{(E - E_F)/kT})\). It is close to 1 well below \(E_F\), close to 0 well above, and exactly 0.5 at \(E_F\). At the hot end of the rod, T is higher, so the change from 1 to 0 is spread over a wider energy range of a few kT. Plot (B) shows f falling smoothly from 1 through 0.5 at \(E_F\) towards 0 as E rises.
Plot (A) has occupancy increasing with energy, which is backwards. Plot (C) is the sharp step of absolute zero, appropriate to a cold end rather than a hot one, and (D), with f = 0.5 at every energy, is not a Fermi distribution.
Post your comment
Please log in or register to post a comment.
Examination Categories
- SSC Exams
- Banking Exams
- Teaching Exams
- Civil Services Exams
- Railways Exams
- Engineering Recruitment Exams
- Defence Exams
- State Government Exams
- Police Exams
- Insurance Exams
- Nursing Exams
- Other Government Exams
- NRA CET
- PG Entrance Exams
- Campus Placement
- MBA Entrance Exams
- CUET and UG Entrance
- Judiciary Exams
- Regulatory Body Exams
- Software Development