
Discussion
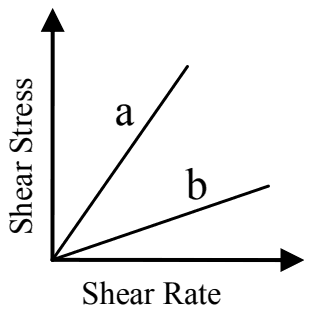
If the flow curves of two viscous fluids are represented by
then, the viscosity plots of the fluids will be
- A.
- B.
- C.
- D.
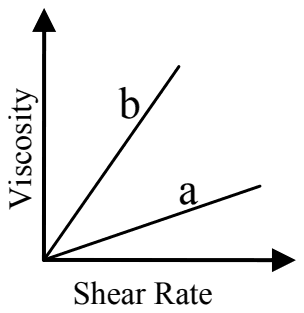
Answer: A
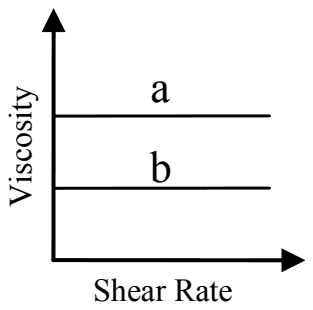
The viscosity plots are (A): two horizontal lines, with a above b.
Both flow curves are straight lines through the origin, so shear stress is proportional to shear rate: both fluids are Newtonian. Their viscosity, the slope \(\tau/\dot{\gamma}\), is a constant that does not change with shear rate, so each plots as a horizontal line on a viscosity against shear rate graph.
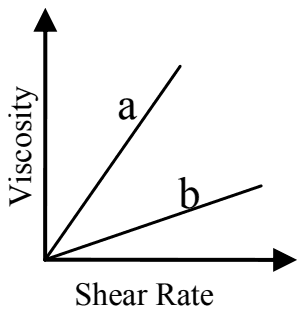
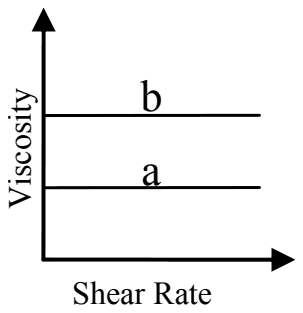
Fluid a has the steeper flow curve, so it has the higher viscosity and its line lies above b's. Plot (C) reverses the order. Plots (B) and (D) show viscosity rising with shear rate, which describes shear-thickening fluids, not straight-line flow curves through the origin.
Post your comment
Please log in or register to post a comment.
Examination Categories
- SSC Exams
- Banking Exams
- Teaching Exams
- Civil Services Exams
- Railways Exams
- Engineering Recruitment Exams
- Defence Exams
- State Government Exams
- Police Exams
- Insurance Exams
- Nursing Exams
- Other Government Exams
- NRA CET
- PG Entrance Exams
- Campus Placement
- MBA Entrance Exams
- CUET and UG Entrance
- Judiciary Exams
- Regulatory Body Exams
- Software Development