
Discussion
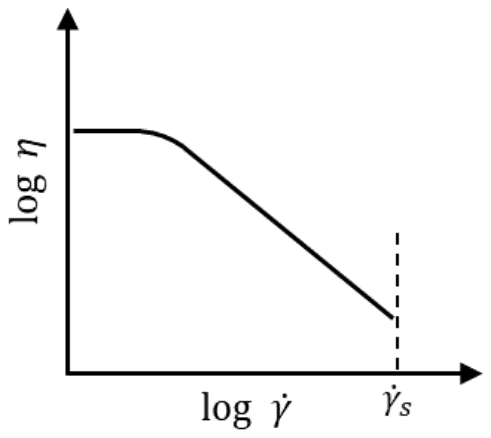
The variation of steady shear viscosity \((\eta)\) of a polymer melt with shear rate \((\dot{\gamma})\) is shown in the figure, where \(\dot{\gamma}_{s}\) is the upper limit of the applied shear rate.
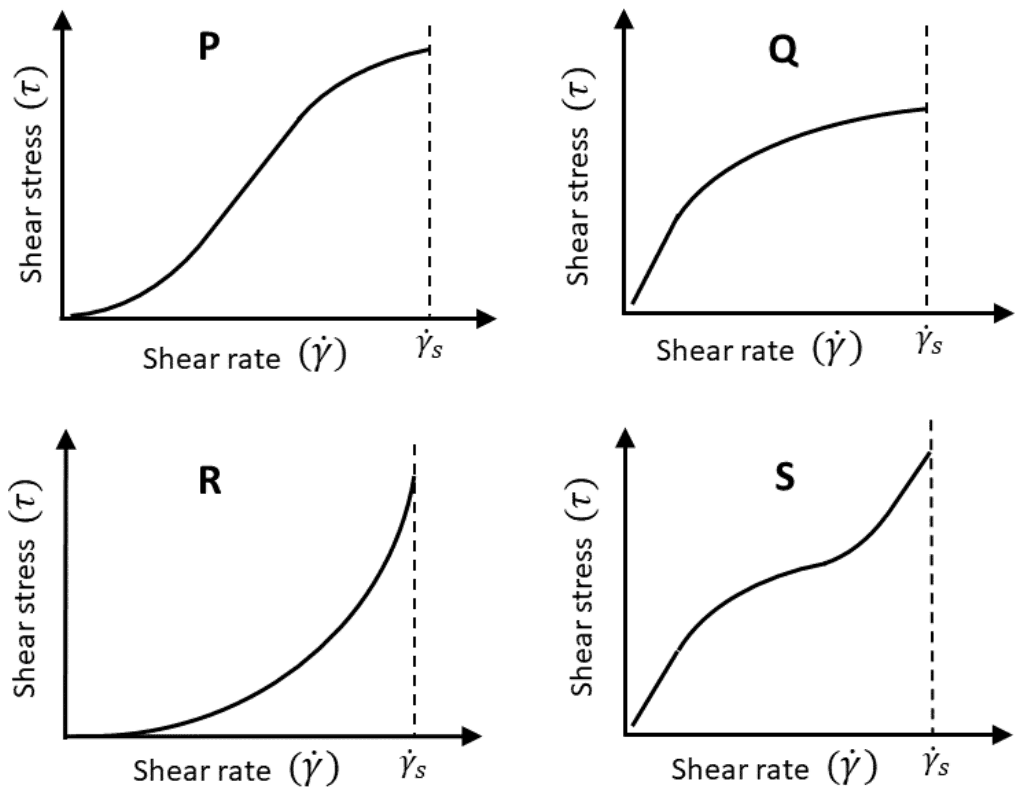
Which one of the following figures, labeled P, Q, R and S, shows the most appropriate variation of shear stress \((\tau)\) with shear rate for the same polymer melt?
Answer: B
The right shear stress curve is Q.
The viscosity curve shows a Newtonian plateau at low shear rate, where viscosity is constant, followed by shear thinning, where viscosity falls as a power of the shear rate. Since \(\tau = \eta\dot{\gamma}\):
- on the plateau, \(\tau\) rises linearly with \(\dot{\gamma}\);
- in the shear-thinning region, \(\tau = K\dot{\gamma}^{n}\) with n less than 1, so \(\tau\) keeps rising but ever more slowly.
Curve Q, a straight start bending over into a flattening rise, matches. R curves upward, which is shear thickening. P starts with zero slope, which would mean zero viscosity at low shear rate, and S's late steep rise would need the viscosity to increase again, which the viscosity curve does not show.
Post your comment
Please log in or register to post a comment.
Examination Categories
- SSC Exams
- Banking Exams
- Teaching Exams
- Civil Services Exams
- Railways Exams
- Engineering Recruitment Exams
- Defence Exams
- State Government Exams
- Police Exams
- Insurance Exams
- Nursing Exams
- Other Government Exams
- NRA CET
- PG Entrance Exams
- Campus Placement
- MBA Entrance Exams
- CUET and UG Entrance
- Judiciary Exams
- Regulatory Body Exams
- Software Development