
Discussion
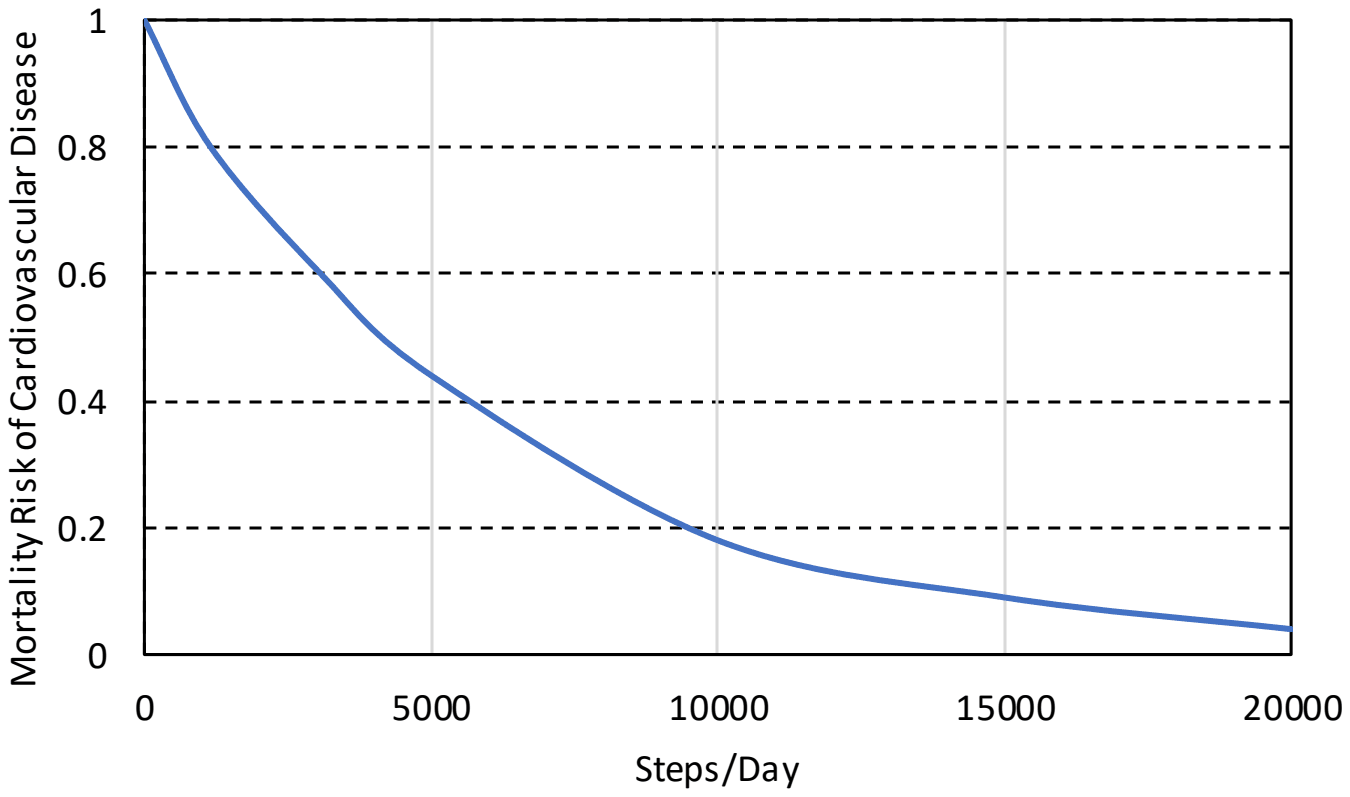
The plot below shows the relationship between the mortality risk of cardiovascular disease and the number of steps a person walks per day. Based on the data, which one of the following options is true?
Answer: C
The true statement is For any 5000 increment in steps/day the largest risk reduction occurs on going from 0 to 5000.
Reading the plot, the risk falls from 1 to about 0.44 between 0 and 5000 steps, a drop of about 0.56. From 5000 to 10000 it falls by about 0.26, from 10000 to 15000 by about 0.09, and from 15000 to 20000 by about 0.05. The curve is steepest at the start and flattens out.
So the first option is false (a drop of about 0.82 from 0 to 10000 against about 0.14 from 10000 to 20000), the second is false (0.56 against 0.05), and the last picks the smallest drop instead of the largest.
Post your comment
Please log in or register to post a comment.
Examination Categories
- SSC Exams
- Banking Exams
- Teaching Exams
- Civil Services Exams
- Railways Exams
- Engineering Recruitment Exams
- Defence Exams
- State Government Exams
- Police Exams
- Insurance Exams
- Nursing Exams
- Other Government Exams
- NRA CET
- PG Entrance Exams
- Campus Placement
- MBA Entrance Exams
- CUET and UG Entrance
- Judiciary Exams
- Regulatory Body Exams
- Software Development