
Discussion
The growth of bacteria (lactobacillus) in milk leads to curd formation. A minimum bacterial population density of 0.8 (in suitable units) is needed to form curd. In the graph below, the population density of lactobacillus in 1 litre of milk is plotted as a function of time, at two different temperatures, 25 °C and 37 °C.
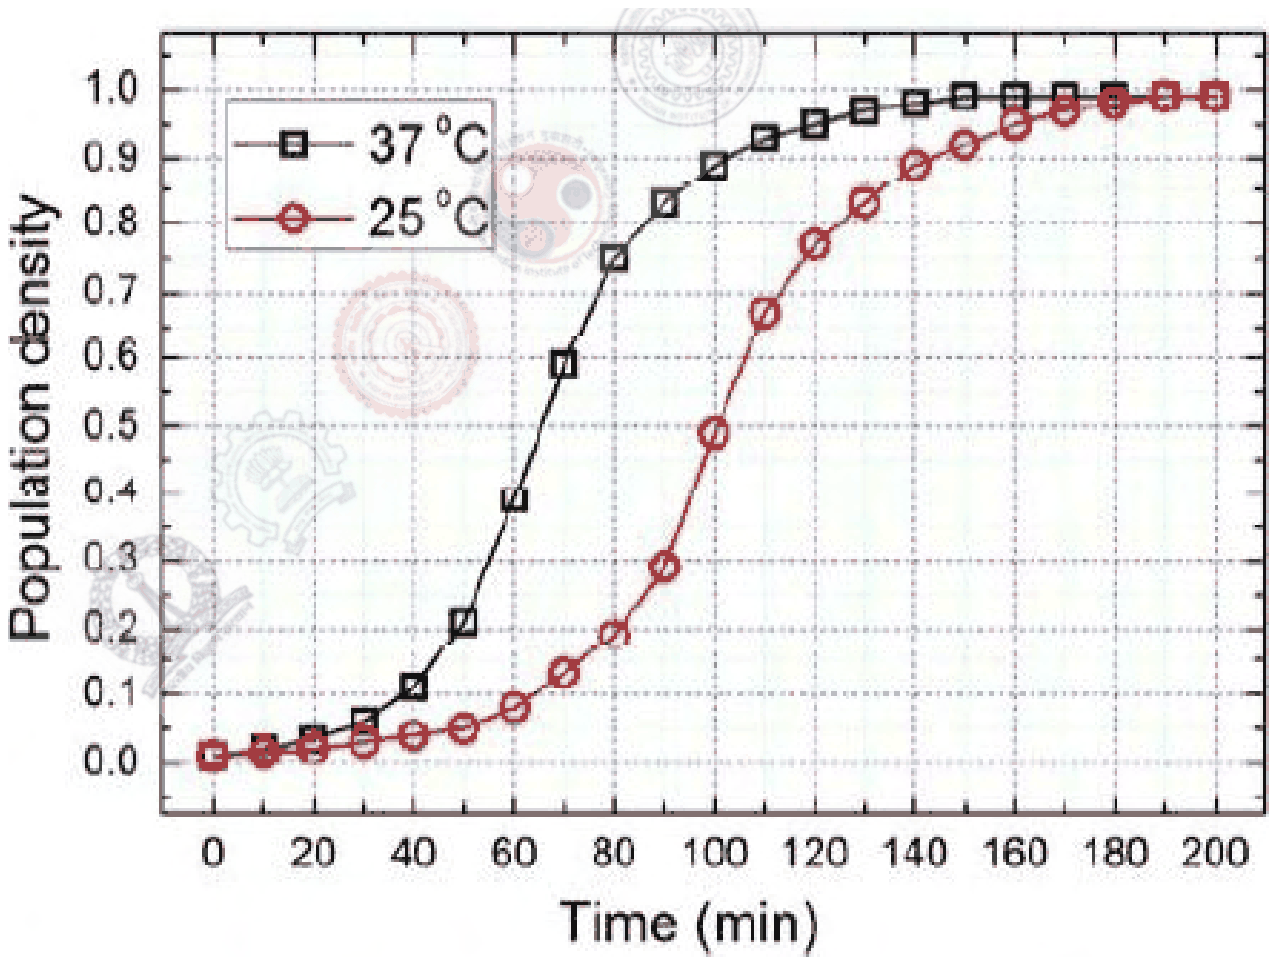
Consider the following statements based on the data shown above:
i. The growth in bacterial population stops earlier at 37 °C as compared to 25 °C
ii. The time taken for curd formation at 25 °C is twice the time taken at 37 °C
Which one of the following options is correct?
Answer: A
The correct option is Only i.
Statement i: the 37 °C curve levels off near 1.0 by about 150 min, while the 25 °C curve keeps rising until about 180 to 190 min. So growth stops earlier at 37 °C, and statement i is true.
Statement ii: curd forms when the density reaches 0.8. The 37 °C curve crosses 0.8 at about 85 min and the 25 °C curve at about 125 min. 125 is roughly 1.5 times 85, not twice, so statement ii is false.
That rules out "Only ii" and "Both i and ii", and "Neither" ignores the earlier plateau at 37 °C.
Post your comment
Please log in or register to post a comment.
Examination Categories
- SSC Exams
- Banking Exams
- Teaching Exams
- Civil Services Exams
- Railways Exams
- Engineering Recruitment Exams
- Defence Exams
- State Government Exams
- Police Exams
- Insurance Exams
- Nursing Exams
- Other Government Exams
- NRA CET
- PG Entrance Exams
- Campus Placement
- MBA Entrance Exams
- CUET and UG Entrance
- Judiciary Exams
- Regulatory Body Exams
- Software Development