
Discussion
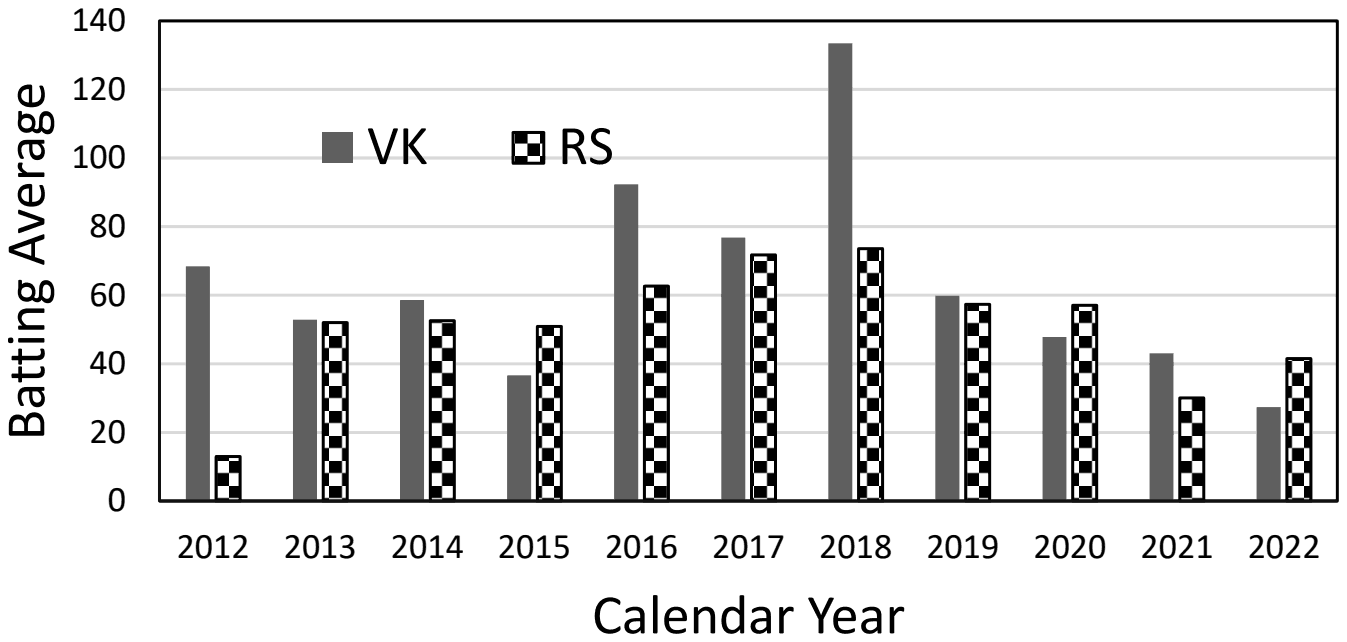
The bar chart gives the batting averages of VK and RS for 11 calendar years from 2012 to 2022. Considering that 2015 and 2019 are world cup years, which one of the following options is true?
Answer: C
The true statement is that VK's yearly batting average is consistently higher than that of RS between the two world cup years.
Between 2015 and 2019 lie 2016, 2017 and 2018. In each, VK's bar is above RS's: about 92 against 63, 77 against 72, and 133 against 74.
The other statements fail on one year each. RS is not higher in every world cup year, because in 2019 VK (about 60) is slightly above RS (about 58). VK is not higher in every world cup year, because in 2015 RS (about 51) is well above VK (about 37). And RS is not consistently higher in the last three years, because in 2021 VK (about 43) is above RS (about 30).
Post your comment
Please log in or register to post a comment.
Examination Categories
- SSC Exams
- Banking Exams
- Teaching Exams
- Civil Services Exams
- Railways Exams
- Engineering Recruitment Exams
- Defence Exams
- State Government Exams
- Police Exams
- Insurance Exams
- Nursing Exams
- Other Government Exams
- NRA CET
- PG Entrance Exams
- Campus Placement
- MBA Entrance Exams
- CUET and UG Entrance
- Judiciary Exams
- Regulatory Body Exams
- Software Development