
Discussion
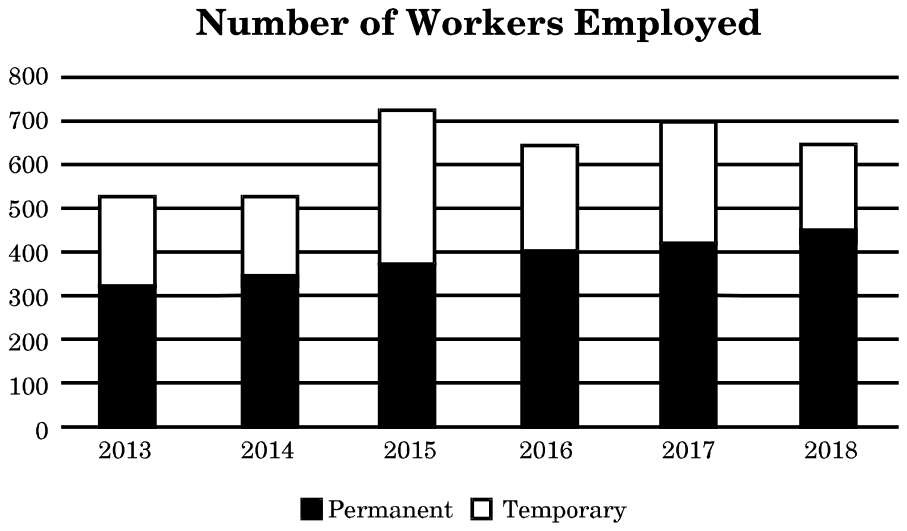
Which year did the company employ the minimum number of temporary employees ?
Answer: B
The fewest temporary employees were employed in 2014.
In the stacked bar chart, the temporary workers are the white upper part of each bar, from the top of the black (permanent) part to the top of the bar. Reading the bars: in 2013 the bar rises from about 325 to about 525 (about 200 temporary), in 2014 from about 350 to about 525 (about 175), in 2016 from about 400 to about 645 (about 245), and in 2018 from about 450 to about 650 (about 200).
2014's white segment is the shortest, about 175 workers. 2013 and 2018 have about 200 each, and 2016 about 245, so those options are wrong.
No comment is present. Be the first to comment.
Loading…
Post your comment
Please log in or register to post a comment.
Examination Categories
- SSC Exams
- Banking Exams
- Teaching Exams
- Civil Services Exams
- Railways Exams
- Engineering Recruitment Exams
- Defence Exams
- State Government Exams
- Police Exams
- Insurance Exams
- Nursing Exams
- Other Government Exams
- NRA CET
- PG Entrance Exams
- Campus Placement
- MBA Entrance Exams
- CUET and UG Entrance
- Judiciary Exams
- Regulatory Body Exams
- Software Development