
Discussion
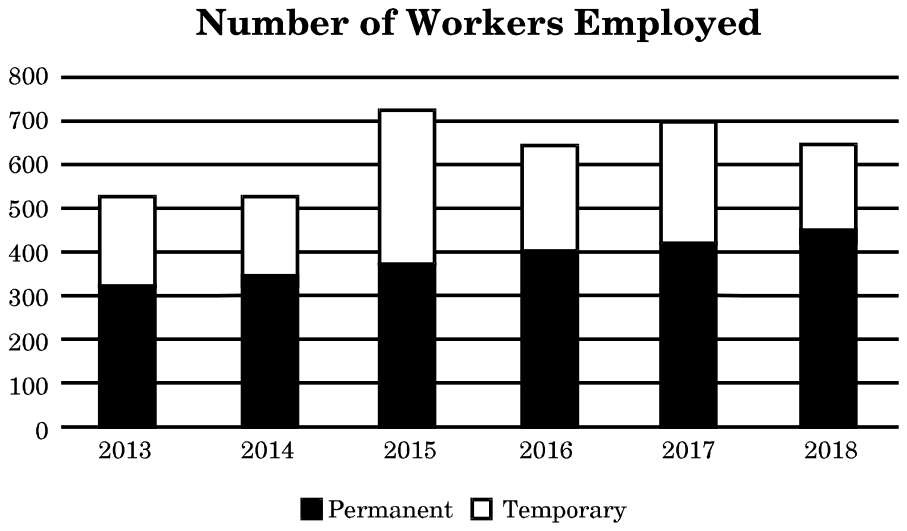
Which year did the company's permanent workers contribute the minimum percentage of the total annual workhours of the entire workforce ?
Answer: C
The permanent workers' share of workhours was lowest in 2015.
The permanent workers' share is 10P / (10P + 6T), with P and T read from the chart:
\[ \begin{aligned} 2013 &: 3250/4450 \approx 73\% \\ 2014 &: 3500/4550 \approx 77\% \\ 2015 &: 3750/5850 \approx 64\% \\ 2016 &: 4000/5470 \approx 73\% \end{aligned} \]
2015 stands out because it had by far the most temporary workers, about 350, nearly as many as its 375 permanent workers, so the temporary workers' hours took a much larger share that year than in 2013, 2014 or 2016.
No comment is present. Be the first to comment.
Loading…
Post your comment
Please log in or register to post a comment.
Examination Categories
- SSC Exams
- Banking Exams
- Teaching Exams
- Civil Services Exams
- Railways Exams
- Engineering Recruitment Exams
- Defence Exams
- State Government Exams
- Police Exams
- Insurance Exams
- Nursing Exams
- Other Government Exams
- NRA CET
- PG Entrance Exams
- Campus Placement
- MBA Entrance Exams
- CUET and UG Entrance
- Judiciary Exams
- Regulatory Body Exams
- Software Development