
Discussion
Which one of the following graphs shows the correct variation of vo with vi? Here, vd is the voltage drop across the diode and the Op-Amp is assumed to be ideal.
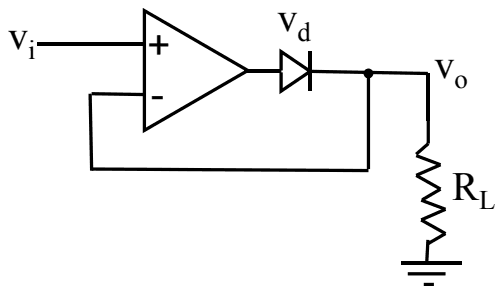
- A.
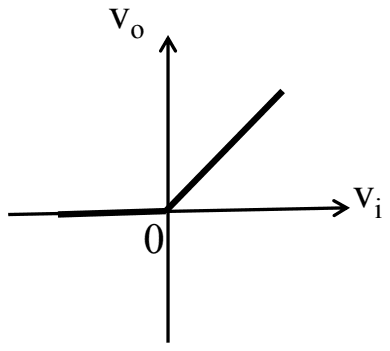
- B.
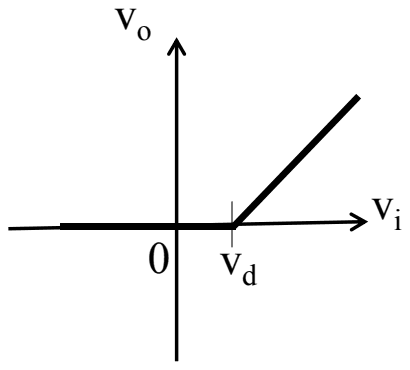
- C.
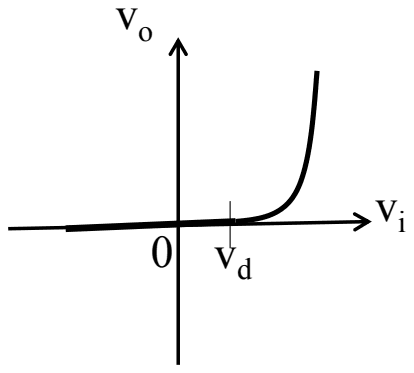
- D.
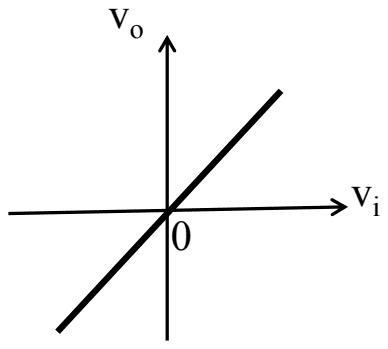
Answer: A
The correct graph is (A): \(v_{o} = 0\) for negative \(v_{i}\) and \(v_{o} = v_{i}\) for positive \(v_{i}\).
The circuit is a precision (super) diode. For \(v_{i} \gt 0\) the op-amp output rises until the diode conducts; the feedback taken from \(v_{o}\) then forces \(v_{o} = v_{i}\), and the op-amp output simply sits \(v_{d}\) higher to cover the diode drop. For \(v_{i} \lt 0\) the op-amp output swings negative, the diode is reverse biased, and \(R_{L}\) pulls \(v_{o}\) to 0.
Graph (B), with a threshold at \(v_{d}\), and graph (C), with the exponential diode curve, describe an ordinary diode without the op-amp; the feedback removes the diode drop entirely. Graph (D) is a plain follower with no rectification.
Post your comment
Please log in or register to post a comment.
Examination Categories
- SSC Exams
- Banking Exams
- Teaching Exams
- Civil Services Exams
- Railways Exams
- Engineering Recruitment Exams
- Defence Exams
- State Government Exams
- Police Exams
- Insurance Exams
- Nursing Exams
- Other Government Exams
- NRA CET
- PG Entrance Exams
- Campus Placement
- MBA Entrance Exams
- CUET and UG Entrance
- Judiciary Exams
- Regulatory Body Exams
- Software Development