
Discussion
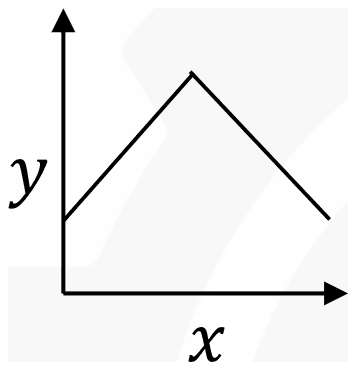
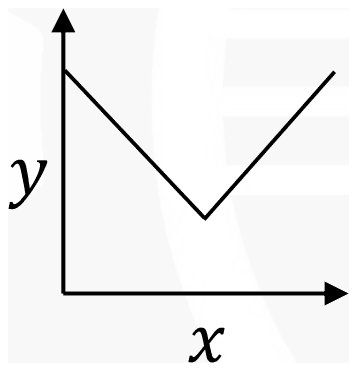
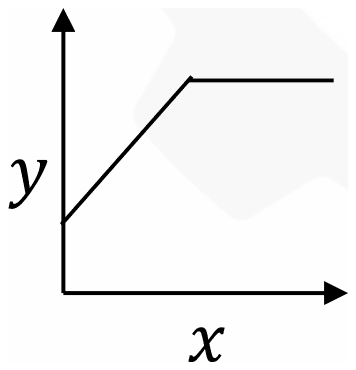
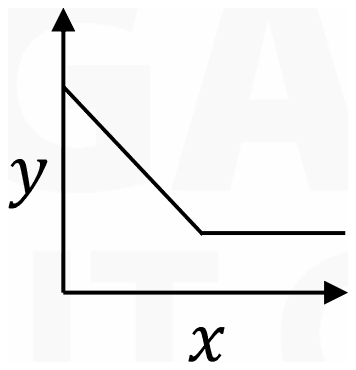
10 mM aqueous HCl is added dropwise to 10 mL of 1 mM aqueous NaOH. The qualitative plot of conductivity (y) against the number of drops of HCl (x) is
- A.
- B.
- C.
- D.
Answer: B
The conductivity first falls and then rises, the V-shaped plot in option (B).
At the start the solution holds Na+ and OH-, and OH- has a very high ionic mobility. Each drop of HCl neutralises some OH- (H+ + OH- → H2O) and puts in its place a Cl- ion, which conducts much less. So conductivity drops steadily until the equivalence point (1 mL of the 10 mM acid for 10 mL of 1 mM base).
After that, the extra drops add H+, the most mobile ion of all, together with Cl-, so the conductivity climbs steeply.
Plot (A) has the trend upside down. Plots (C) and (D) level off, which would need the acid to stop adding ions after the equivalence point; excess HCl keeps raising the conductivity.
Post your comment
Please log in or register to post a comment.
Examination Categories
- SSC Exams
- Banking Exams
- Teaching Exams
- Civil Services Exams
- Railways Exams
- Engineering Recruitment Exams
- Defence Exams
- State Government Exams
- Police Exams
- Insurance Exams
- Nursing Exams
- Other Government Exams
- NRA CET
- PG Entrance Exams
- Campus Placement
- MBA Entrance Exams
- CUET and UG Entrance
- Judiciary Exams
- Regulatory Body Exams
- Software Development