
Discussion
For a simple enzyme that follows Michaelis-Menten kinetics, kinetic data was collected in the absence (dotted line, -I), or presence (solid line, +I) of an uncompetitive inhibitor (I). Which one of the following Eadie-Hofstee plots best describes the expected result?
(\(v_{o}\) = initial velocity, [S] = free substrate concentration)
- A.
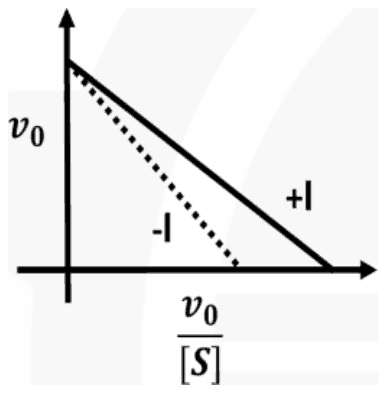
- B.
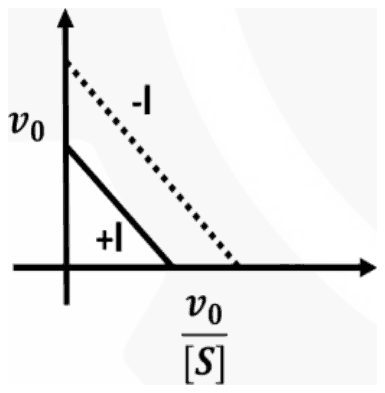
- C.
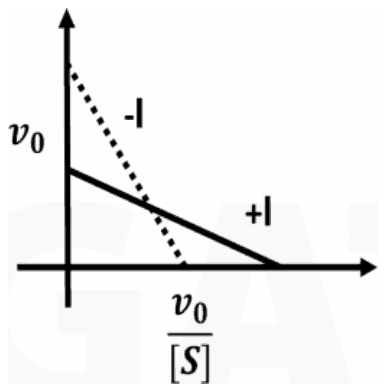
- D.
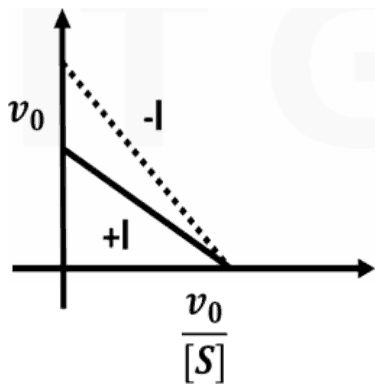
Answer: D
The expected Eadie-Hofstee plot is (D): the two lines meet on the x-axis, and the inhibited line is lower and less steep.
An Eadie-Hofstee plot graphs \(v_{0}\) against \(v_{0}/[S]\):
\[ v_{0} = V_{max} - K_{m}\frac{v_{0}}{[S]} \]
The y-intercept is \(V_{max}\), the slope is \(-K_{m}\) and the x-intercept is \(V_{max}/K_{m}\). An uncompetitive inhibitor binds only the enzyme-substrate complex and divides both \(V_{max}\) and \(K_{m}\) by the same factor. So the y-intercept falls, the line becomes less steep, and the x-intercept \(V_{max}/K_{m}\) stays where it was.
Plot (B) has parallel lines (same slope, so unchanged \(K_{m}\)), the pattern of a pure non-competitive inhibitor. Plot (A) keeps the y-intercept, as a competitive inhibitor would, but moves the x-intercept the wrong way. Plot (C) changes the x-intercept, so \(V_{max}/K_{m}\) is not conserved.
Post your comment
Please log in or register to post a comment.
Examination Categories
- SSC Exams
- Banking Exams
- Teaching Exams
- Civil Services Exams
- Railways Exams
- Engineering Recruitment Exams
- Defence Exams
- State Government Exams
- Police Exams
- Insurance Exams
- Nursing Exams
- Other Government Exams
- NRA CET
- PG Entrance Exams
- Campus Placement
- MBA Entrance Exams
- CUET and UG Entrance
- Judiciary Exams
- Regulatory Body Exams
- Software Development