
Discussion
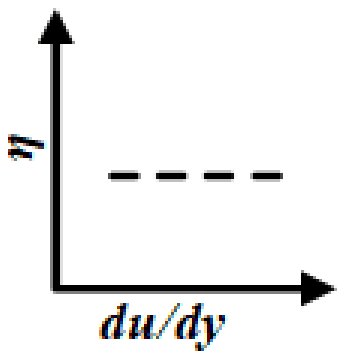
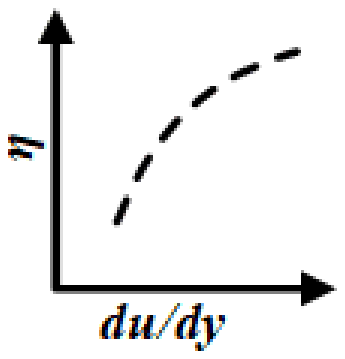
Which one of the following figures shows the CORRECT dependence of apparent viscosity (\(\eta\)) on rate of shear strain (\(du/dy\)) for pseudoplastic fluids?
- A.
- B.
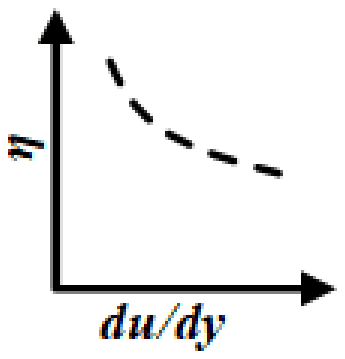
- C.

- D.
Answer: B
The correct plot is (B), apparent viscosity falling as the shear rate rises.
A pseudoplastic fluid is shear-thinning: in the power-law model \(\tau = K(du/dy)^{n}\) its index is \(n \lt 1\), so the apparent viscosity \(\eta = K(du/dy)^{n-1}\) decreases with increasing shear rate. Polymer solutions, paints and blood behave this way.
Plot (A), a constant viscosity, describes a Newtonian fluid. Plots (C) and (D), viscosity rising with shear rate, describe a dilatant (shear-thickening) fluid with \(n \gt 1\), such as a dense starch suspension.
Post your comment
Please log in or register to post a comment.
Examination Categories
- SSC Exams
- Banking Exams
- Teaching Exams
- Civil Services Exams
- Railways Exams
- Engineering Recruitment Exams
- Defence Exams
- State Government Exams
- Police Exams
- Insurance Exams
- Nursing Exams
- Other Government Exams
- NRA CET
- PG Entrance Exams
- Campus Placement
- MBA Entrance Exams
- CUET and UG Entrance
- Judiciary Exams
- Regulatory Body Exams
- Software Development