
Discussion
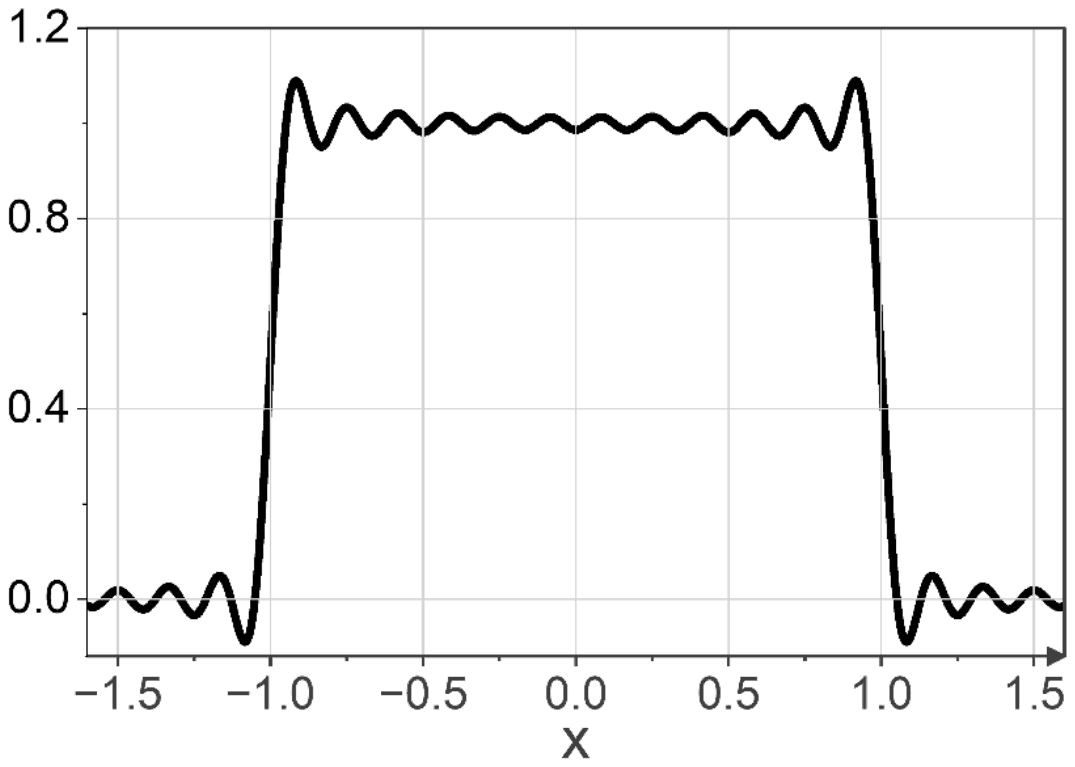
The Fourier series representation of a square wave is shown in the figure below. The fluctuations seen near x = ±1 are named after which one of the following scientists?
Answer: C
The fluctuations are the Gibbs phenomenon.
When a function with a jump discontinuity, such as a square wave, is represented by a truncated Fourier series, the partial sums overshoot and ring near the jump. Adding more terms squeezes the ripples closer to the discontinuity but does not reduce the peak overshoot, which stays near 9% of the jump. J. Willard Gibbs explained this in 1899, and it is named after him.
Fourier gave the series itself, not the overshoot. Cauchy and Laplace are associated with other results (Cauchy's integral theorem, the Laplace transform and equation) and not with this effect.
Post your comment
Please log in or register to post a comment.
Examination Categories
- SSC Exams
- Banking Exams
- Teaching Exams
- Civil Services Exams
- Railways Exams
- Engineering Recruitment Exams
- Defence Exams
- State Government Exams
- Police Exams
- Insurance Exams
- Nursing Exams
- Other Government Exams
- NRA CET
- PG Entrance Exams
- Campus Placement
- MBA Entrance Exams
- CUET and UG Entrance
- Judiciary Exams
- Regulatory Body Exams
- Software Development