
Discussion
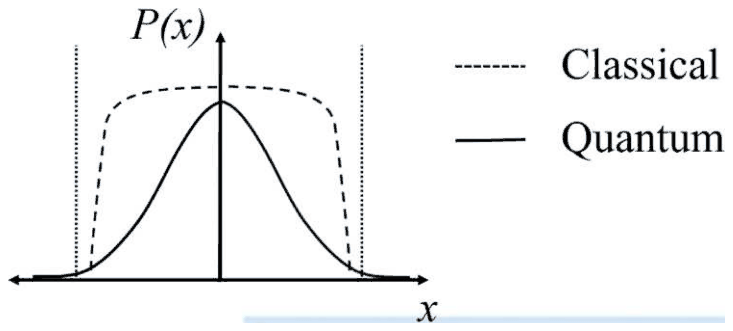
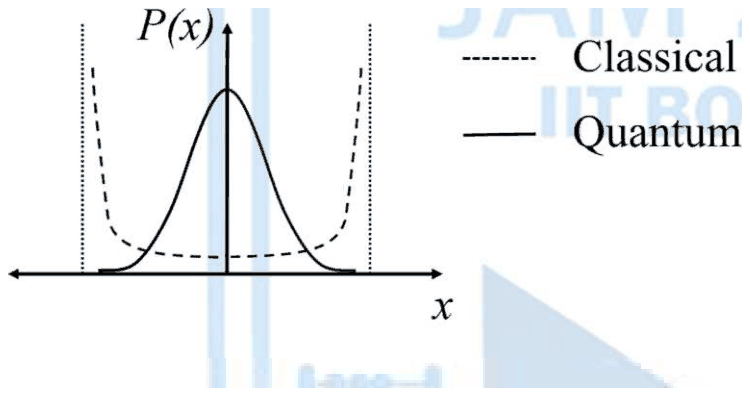
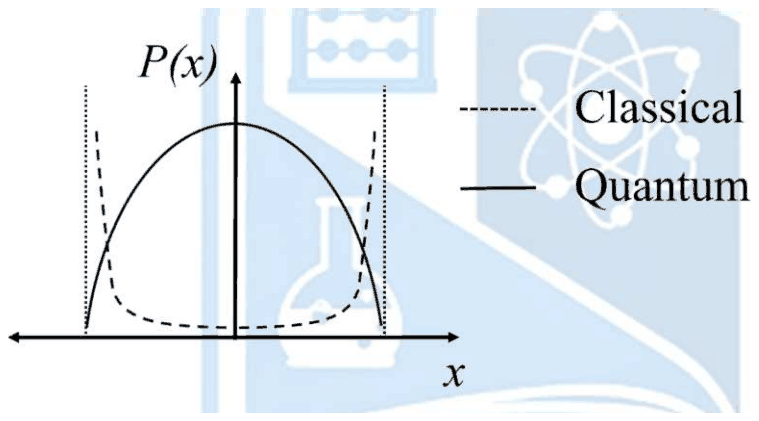
Which ONE of the following figures correctly represents the probability density, \(P(x)\), of a particle undergoing simple harmonic oscillation as a function of position \(x\)?
The dashed line is for the classical case. The solid line is for the quantum case, where the system is in its ground state. The dotted vertical lines on the \(x\) axis denote the classical turning points.
- A.
- B.
- C.
- D.
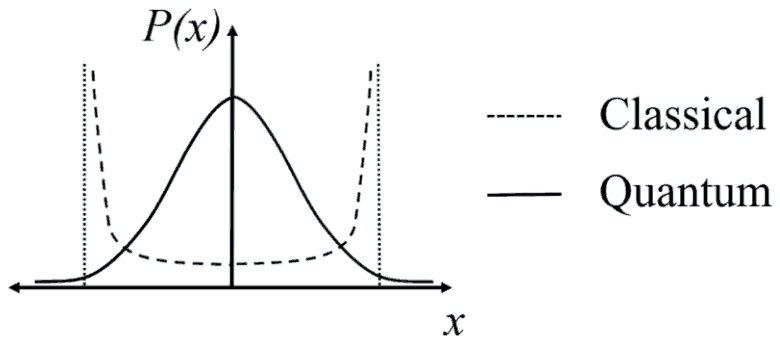
Answer: D
The correct figure is (D): a Gaussian ground-state density, peaked at the centre and leaking past the turning points, drawn with the classical U-shaped density.
Classically the particle moves slowest near the turning points, so it spends most time there: \(P_{cl}(x) \propto \frac{1}{v(x)} \propto \frac{1}{\sqrt{x_{0}^{2} - x^{2}}}\). This is smallest at the centre and grows without limit at \(x = \pm x_{0}\), the dashed U shape.
The ground state is \(\psi_{0} \propto e^{-m\omega x^{2}/2\hbar}\), so \(P(x) \propto e^{-m\omega x^{2}/\hbar}\). It is largest at \(x = 0\). Its turning points are at \(x_{0}^{2} = \frac{\hbar}{m\omega}\), where \(P\) has only fallen to \(\frac{1}{e}\) of its peak, so it extends well beyond them into the classically forbidden region.
(A) wrongly draws a flat-topped classical curve. (B) draws a quantum curve that has died out before the turning points, so no penetration. (C) draws a quantum curve shaped like a parabola that ends exactly at the turning points, which a wavefunction never does.
Post your comment
Please log in or register to post a comment.
Examination Categories
- SSC Exams
- Banking Exams
- Teaching Exams
- Civil Services Exams
- Railways Exams
- Engineering Recruitment Exams
- Defence Exams
- State Government Exams
- Police Exams
- Insurance Exams
- Nursing Exams
- Other Government Exams
- NRA CET
- PG Entrance Exams
- Campus Placement
- MBA Entrance Exams
- CUET and UG Entrance
- Judiciary Exams
- Regulatory Body Exams
- Software Development