
Discussion
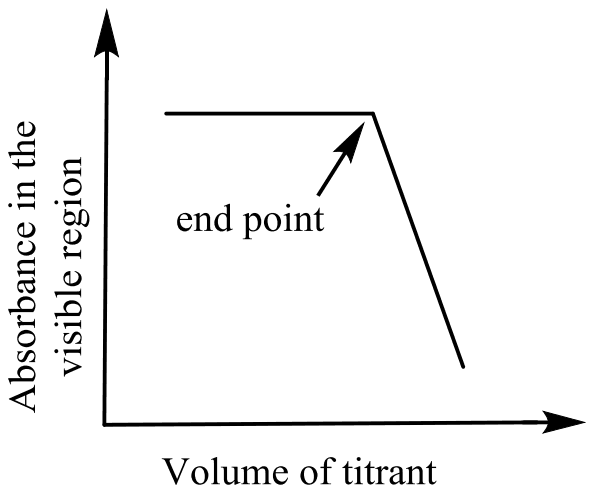
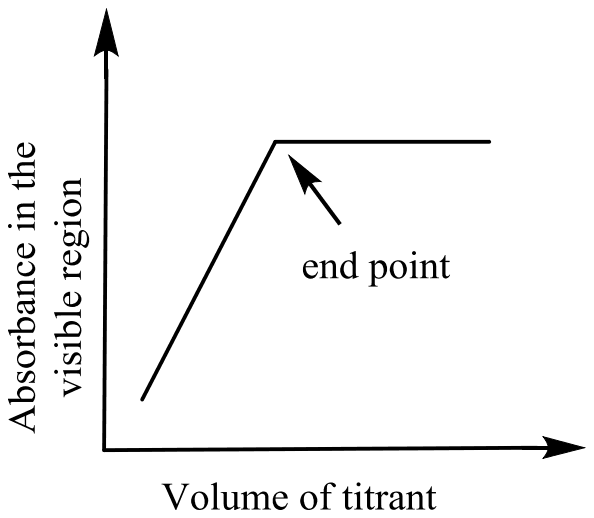
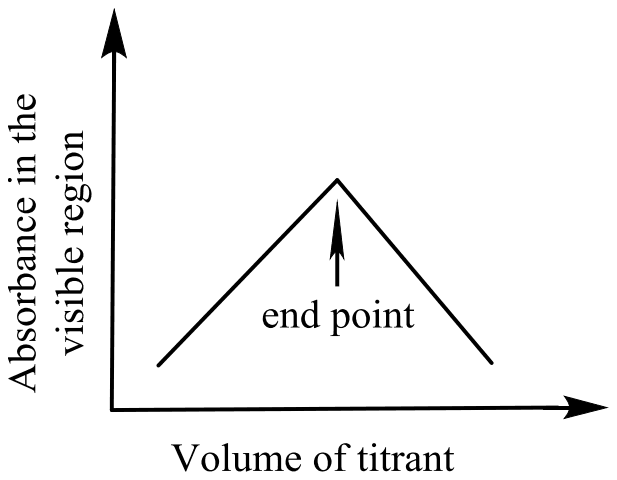
Which plot represents a spectrophotometric titration, where the titrant alone absorbs light in the visible region?
- A.

- B.
- C.
- D.
Answer: A
The correct plot is (A).
In a spectrophotometric titration the absorbance is measured in the visible region as titrant is added. If only the titrant absorbs, the added titrant is consumed by the analyte until the end point, so the absorbance stays at its low baseline. After the end point the excess titrant accumulates and the absorbance rises linearly with volume. The graph is flat and then rises, with the end point at the break, as in (A).
(B) and (C) start with a high absorbance, which would need the analyte or product to absorb. (D) rises and then falls, which suits a case where a coloured species forms and then is used up, not a titrant that is only absorbing after the end point.
Post your comment
Please log in or register to post a comment.
Examination Categories
- SSC Exams
- Banking Exams
- Teaching Exams
- Civil Services Exams
- Railways Exams
- Engineering Recruitment Exams
- Defence Exams
- State Government Exams
- Police Exams
- Insurance Exams
- Nursing Exams
- Other Government Exams
- NRA CET
- PG Entrance Exams
- Campus Placement
- MBA Entrance Exams
- CUET and UG Entrance
- Judiciary Exams
- Regulatory Body Exams
- Software Development