
Discussion
The wavefunction of a particle in one dimension is given by
\[ \psi(x) = \begin{cases} M, & -a \lt x \lt a \\ 0, & \text{otherwise.} \end{cases} \]
Here \(M\) and \(a\) are positive constants. If \(\varphi(p)\) is the corresponding momentum space wavefunction, which one of the following plots best represents \(|\varphi(p)|^{2}\)?
- A.
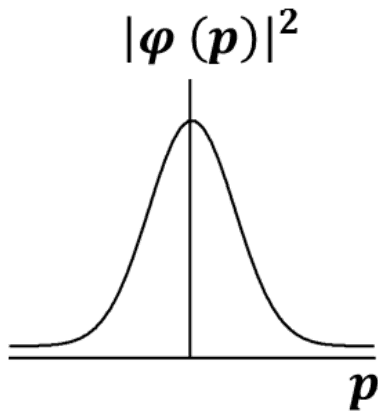
- B.
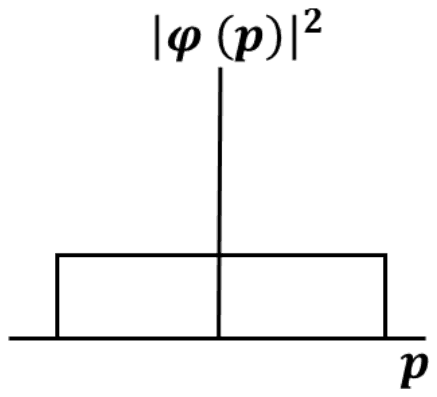
- C.
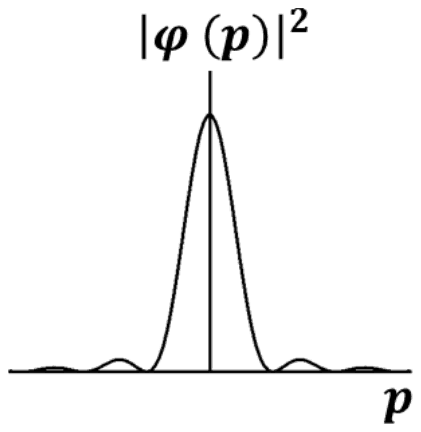
- D.
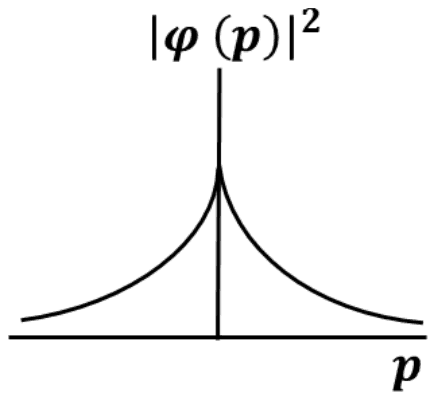
Answer: C
The momentum distribution is a central peak with decaying side lobes, plot (C).
The momentum space wavefunction is the Fourier transform of the box function:
\[ \begin{aligned} \varphi(p) &= \frac{M}{\sqrt{2\pi\hbar}}\int_{-a}^{a} e^{-ipx/\hbar}\,dx \\ &= \frac{2M\hbar}{\sqrt{2\pi\hbar}}\,\frac{\sin(pa/\hbar)}{p} \end{aligned} \]
So \(|\varphi(p)|^{2} \propto \sin^{2}(pa/\hbar)/p^{2}\): a tall peak at \(p = 0\), zeros at \(p = n\pi\hbar/a\), and side lobes that shrink as \(1/p^{2}\).
A Gaussian (A) is the transform of a Gaussian, not of a box. A flat rectangle (B) would be the momentum distribution of a sinc-shaped wavefunction, the reverse transform. A cusp (D) is the transform of an exponential, such as \(e^{-|x|/a}\).
Post your comment
Please log in or register to post a comment.
Examination Categories
- SSC Exams
- Banking Exams
- Teaching Exams
- Civil Services Exams
- Railways Exams
- Engineering Recruitment Exams
- Defence Exams
- State Government Exams
- Police Exams
- Insurance Exams
- Nursing Exams
- Other Government Exams
- NRA CET
- PG Entrance Exams
- Campus Placement
- MBA Entrance Exams
- CUET and UG Entrance
- Judiciary Exams
- Regulatory Body Exams
- Software Development