
Discussion
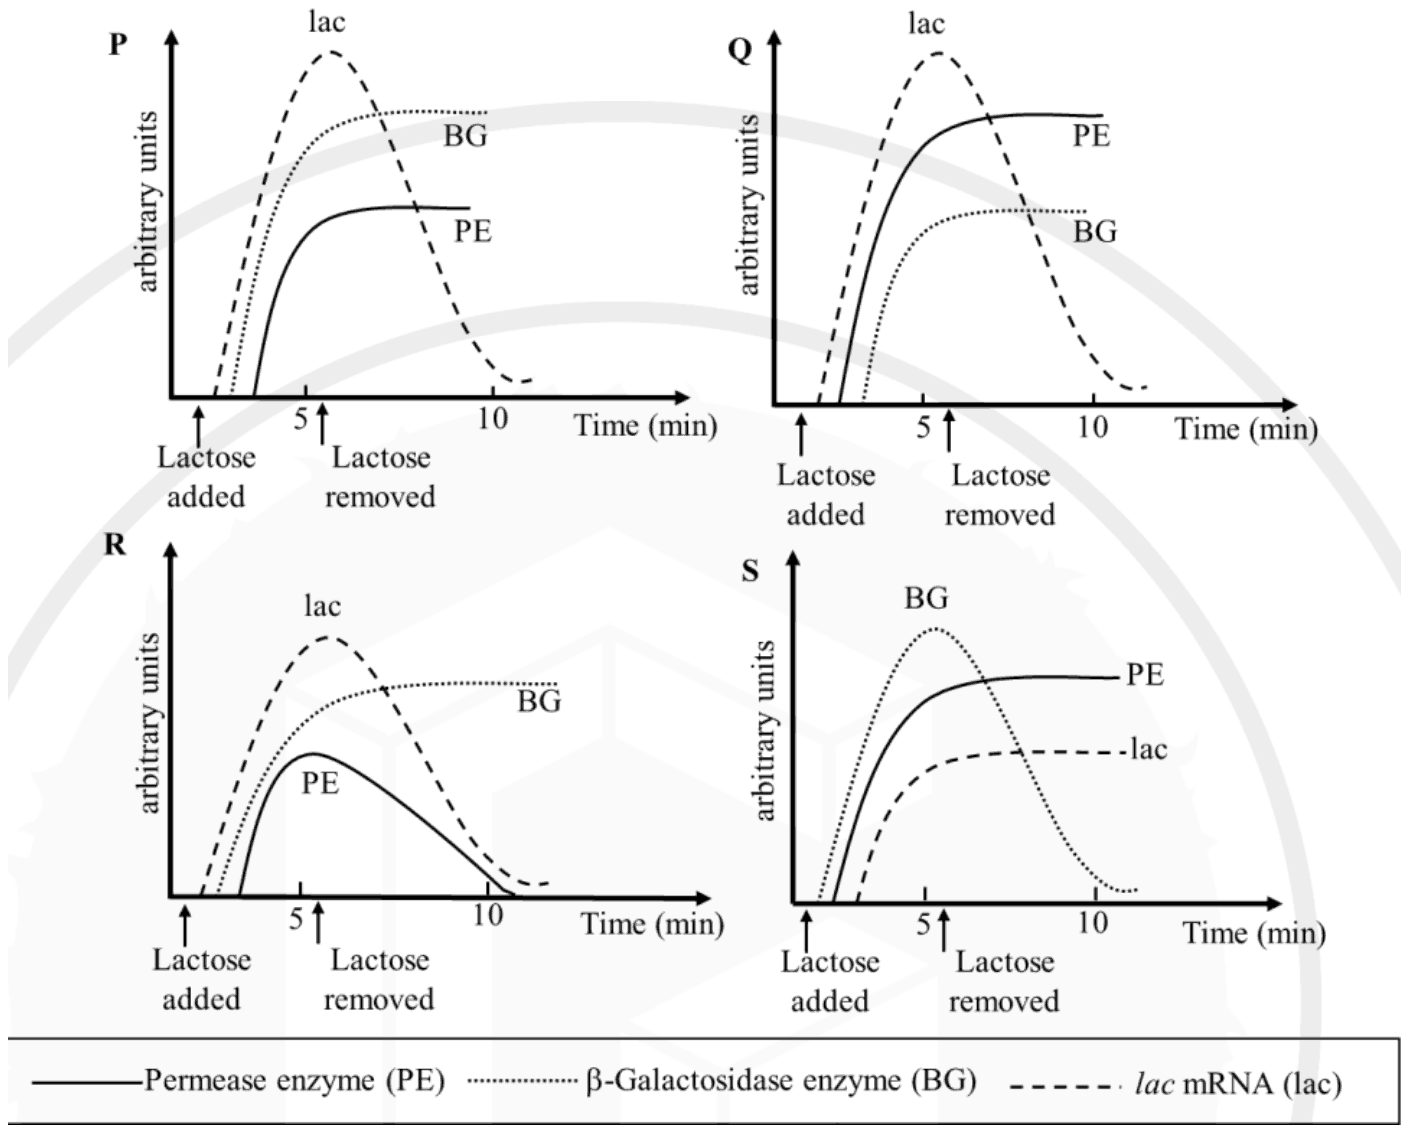
A culture of lac+ Escherichia coli is grown in a medium lacking lactose or any other β-galactoside. The response of the lac operon upon induction by lactose can be monitored by measuring the levels of lac mRNA, β-galactosidase enzyme and permease enzyme. Which one of the following profiles correctly captures the on-off response to lactose?
Answer: A
The correct profile is P.
When lactose is added, the repressor is released and transcription starts almost at once, so lac mRNA rises first. Bacterial mRNA is very short-lived (a half-life of a few minutes), so when lactose is removed and transcription stops, the mRNA level falls back quickly.
The enzymes appear slightly later, since they must be translated from the mRNA, and then level off rather than fall: the proteins are stable, so after induction stops they remain, only diluted by growth. β-Galactosidase, from the first gene of the operon, is made in larger amounts than permease, which is encoded further downstream. Profile P shows all three features.
Q puts permease above β-galactosidase. R shows permease being lost within minutes of removing lactose, as if it were as unstable as the mRNA. S has the mRNA rising last and staying high while β-galactosidase disappears, the reverse of the real behaviour of message and protein.
Post your comment
Please log in or register to post a comment.
Examination Categories
- SSC Exams
- Banking Exams
- Teaching Exams
- Civil Services Exams
- Railways Exams
- Engineering Recruitment Exams
- Defence Exams
- State Government Exams
- Police Exams
- Insurance Exams
- Nursing Exams
- Other Government Exams
- NRA CET
- PG Entrance Exams
- Campus Placement
- MBA Entrance Exams
- CUET and UG Entrance
- Judiciary Exams
- Regulatory Body Exams
- Software Development