
Discussion
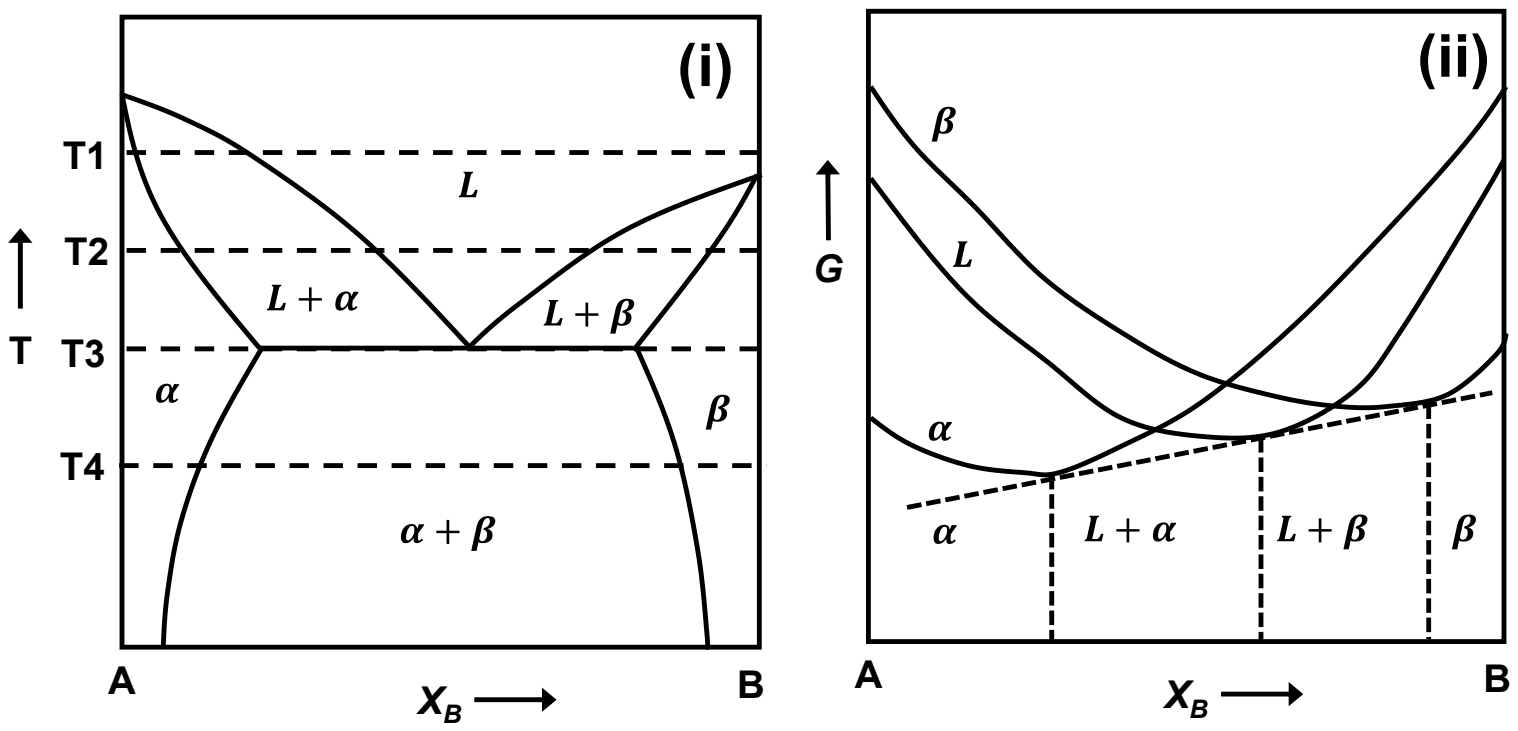
Figures (i) and (ii) show a binary phase diagram and the corresponding Gibbs free energy (\(G\)) vs. composition (\(X_{B}\)) diagram, respectively. Figure (ii) corresponds to which one of the temperatures shown in Figure (i)?
Answer: C
Figure (ii) corresponds to T3.
Equilibrium phases are found by common tangents to the free energy curves. In figure (ii) a single straight tangent touches the \(\alpha\), \(L\) and \(\beta\) curves at once, so three phases coexist in equilibrium. In a binary system at fixed pressure that happens only at the invariant eutectic temperature, which is T3 in figure (i).
At T1 the liquid curve would lie below both solid curves over most of the range. At T2 there would be two separate tangents, \(\alpha\)-\(L\) and \(L\)-\(\beta\), with a single-phase liquid range between them. At T4 the liquid curve would lie above everything, and a single tangent would join only \(\alpha\) and \(\beta\).
Post your comment
Please log in or register to post a comment.
Examination Categories
- SSC Exams
- Banking Exams
- Teaching Exams
- Civil Services Exams
- Railways Exams
- Engineering Recruitment Exams
- Defence Exams
- State Government Exams
- Police Exams
- Insurance Exams
- Nursing Exams
- Other Government Exams
- NRA CET
- PG Entrance Exams
- Campus Placement
- MBA Entrance Exams
- CUET and UG Entrance
- Judiciary Exams
- Regulatory Body Exams
- Software Development