
Discussion
A binary phase diagram is given below.
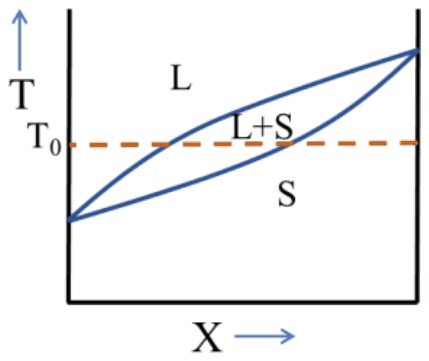
Which one of the following figures qualitatively represents the G-X (Gibbs free energy - composition) plot at temperature T0 shown in the phase diagram?
- A.
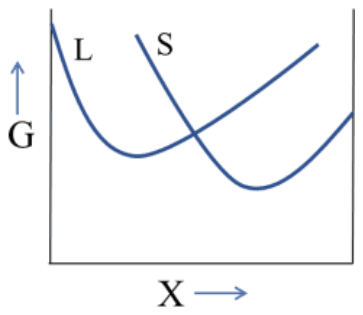
- B.
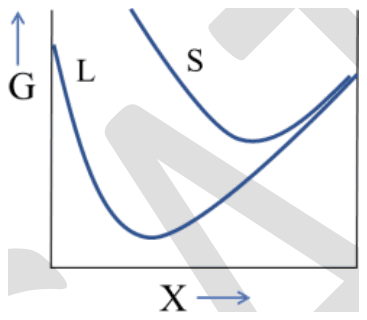
- C.
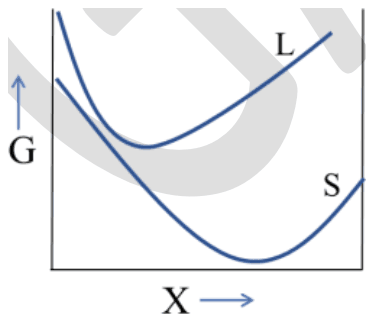
- D.
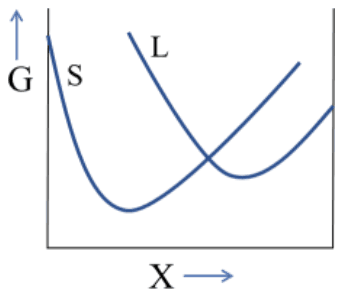
Answer: A
The correct G-X plot is (A).
The diagram is an isomorphous system, with liquidus and solidus rising from the lower-melting component on the left to the higher-melting one on the right. At \(T_0\), alloys near the left are liquid and those near the right are solid, with a two-phase L+S range between.
So the liquid free-energy curve must be lower on the left and the solid curve lower on the right, the two curves crossing so that a common tangent spans the L+S range. Plot (A) shows exactly this: the L curve's minimum on the left, the S curve's minimum on the right, and the curves crossing between them.
In (B) the liquid is lower everywhere, which would make every composition liquid at \(T_0\). In (C) the solid is lower over nearly all compositions. In (D) the roles are reversed, putting the solid on the low-melting side.
Post your comment
Please log in or register to post a comment.
Examination Categories
- SSC Exams
- Banking Exams
- Teaching Exams
- Civil Services Exams
- Railways Exams
- Engineering Recruitment Exams
- Defence Exams
- State Government Exams
- Police Exams
- Insurance Exams
- Nursing Exams
- Other Government Exams
- NRA CET
- PG Entrance Exams
- Campus Placement
- MBA Entrance Exams
- CUET and UG Entrance
- Judiciary Exams
- Regulatory Body Exams
- Software Development