
Discussion
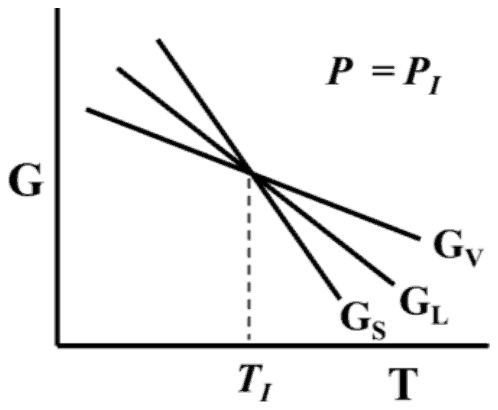
The triple point \((T_{I}, P_{I})\) is shown in a schematic phase diagram (pressure (P) - temperature (T) plot) for one component system. GS, GL and GV are the free energies of solid, liquid and vapor, respectively. At a constant pressure, \(P_{I}\), the correct free energy (G) versus temperature (T) plot is
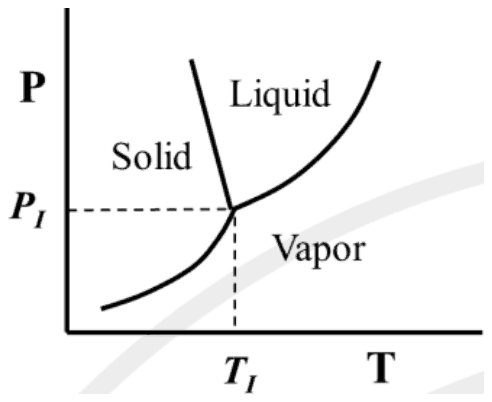
- A.
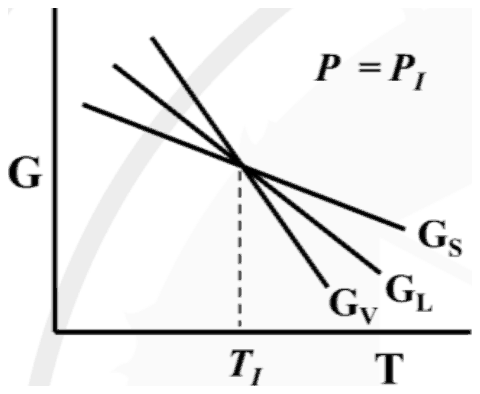
- B.
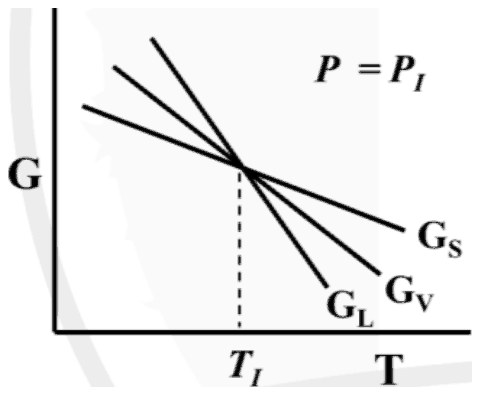
- C.
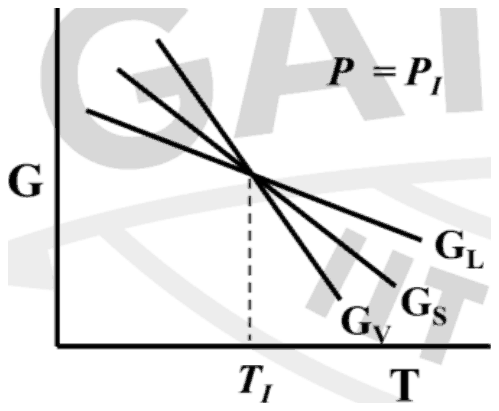
- D.
Answer: A
The correct plot is (A): at \(T_{I}\) all three lines cross, with \(G_{V}\) steepest, \(G_{L}\) next and \(G_{S}\) shallowest.
At constant pressure \((\partial G/\partial T)_{P} = -S\), so each line falls with a slope equal to the phase's entropy. Vapor has the highest entropy, liquid less and solid the least: \(S_{V} \gt S_{L} \gt S_{S}\). At the triple point pressure all three phases coexist at \(T_{I}\), so their free energies are equal there and the three lines meet at one point.
As a check, plot (A) has the solid lowest below \(T_{I}\) and the vapor lowest above it, which matches the phase diagram along \(P = P_{I}\): solid below the triple point, vapor above. Plots (B), (C) and (D) give the liquid or the solid the steepest line, which would require a larger entropy than the vapor.
Post your comment
Please log in or register to post a comment.
Examination Categories
- SSC Exams
- Banking Exams
- Teaching Exams
- Civil Services Exams
- Railways Exams
- Engineering Recruitment Exams
- Defence Exams
- State Government Exams
- Police Exams
- Insurance Exams
- Nursing Exams
- Other Government Exams
- NRA CET
- PG Entrance Exams
- Campus Placement
- MBA Entrance Exams
- CUET and UG Entrance
- Judiciary Exams
- Regulatory Body Exams
- Software Development