
Discussion
Three phases, α, β and L are shown in the binary phase diagram below. Identify the correct G - X (Gibbs free energy vs Composition) plot corresponding to temperature T0.
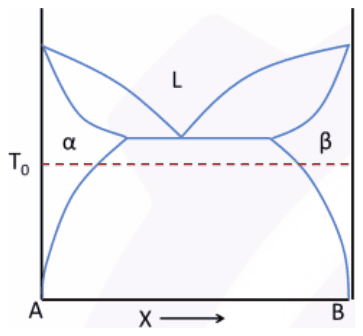
- A.
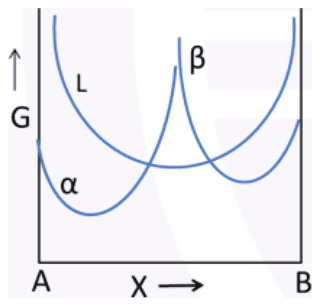
- B.
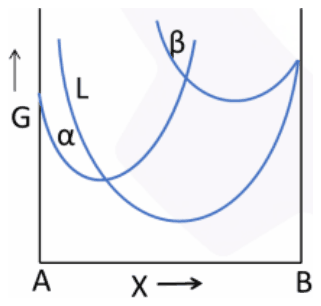
- C.
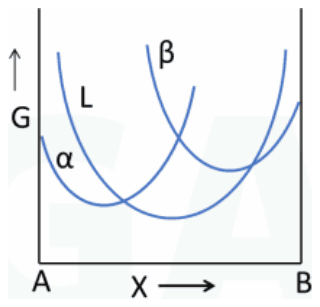
- D.
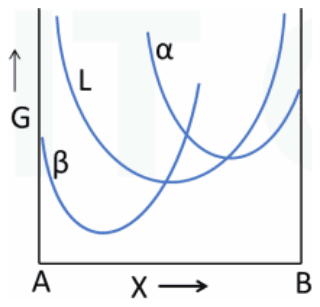
Answer: A
The correct G - X plot is (A).
T0 lies below the eutectic temperature, where the equilibrium phases are α at the A-rich side, β at the B-rich side, and a two-phase α + β mixture between them. No liquid is stable at any composition.
In the free energy diagram this requires the α curve to have its minimum near A, the β curve its minimum near B, and the liquid curve to lie entirely above the common tangent drawn to the α and β curves. Plot (A) shows exactly this.
In (B) and (C) the liquid curve reaches below the solid curves, so liquid would be stable at intermediate compositions, which holds only above the eutectic temperature. (D) places the curves labelled β near A and α near B, the reverse of the phase diagram.
Post your comment
Please log in or register to post a comment.
Examination Categories
- SSC Exams
- Banking Exams
- Teaching Exams
- Civil Services Exams
- Railways Exams
- Engineering Recruitment Exams
- Defence Exams
- State Government Exams
- Police Exams
- Insurance Exams
- Nursing Exams
- Other Government Exams
- NRA CET
- PG Entrance Exams
- Campus Placement
- MBA Entrance Exams
- CUET and UG Entrance
- Judiciary Exams
- Regulatory Body Exams
- Software Development