
Discussion
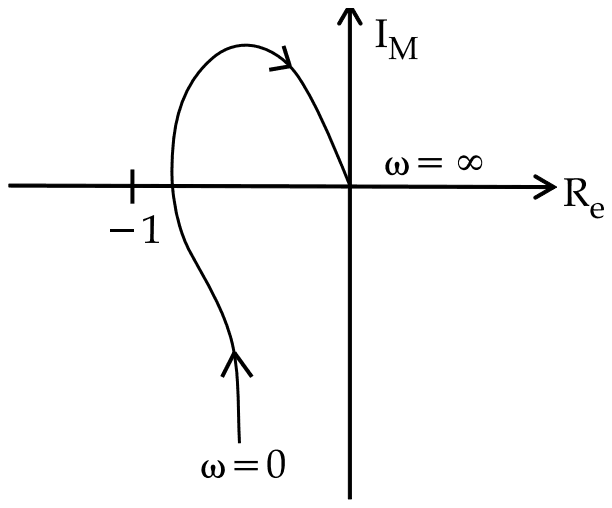
The Nyquist diagram of a LTI system is shown in figure. The system is :
Answer: D
The system is stable.
By the Nyquist criterion, the closed-loop system is stable when the plot of the open-loop frequency response does not encircle the critical point −1 + j0 (for an open-loop system with no poles in the right half plane, which is the usual assumption in such questions).
The plot crosses the negative real axis between −1 and the origin, so the gain margin is greater than one and the point −1 lies outside the curve. A plot passing through −1 would mean marginal stability, and one enclosing it would mean instability. Strictly, a full test also needs the number of open-loop right-half-plane poles, which is why 'insufficient information' is tempting, but the question intends the standard reading.
Post your comment
Please log in or register to post a comment.
Examination Categories
- SSC Exams
- Banking Exams
- Teaching Exams
- Civil Services Exams
- Railways Exams
- Engineering Recruitment Exams
- Defence Exams
- State Government Exams
- Police Exams
- Insurance Exams
- Nursing Exams
- Other Government Exams
- NRA CET
- PG Entrance Exams
- Campus Placement
- MBA Entrance Exams
- CUET and UG Entrance
- Judiciary Exams
- Regulatory Body Exams
- Software Development