
Discussion
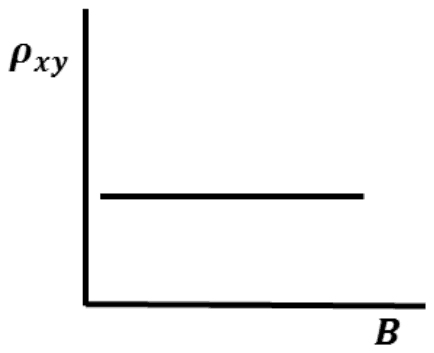
The Hall experiment is carried out with a non-magnetic semiconductor. The current \(I\) is along the \(x\)-axis and the magnetic field \(B\) is along the \(z\)-axis. Which one of the following is the CORRECT representation of the variation of the magnitude of the Hall resistivity \(\rho_{xy}\) as a function of the magnetic field?
- A.
- B.
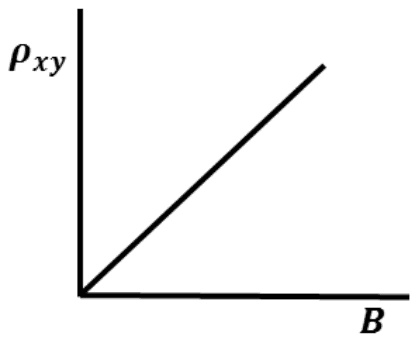
- C.
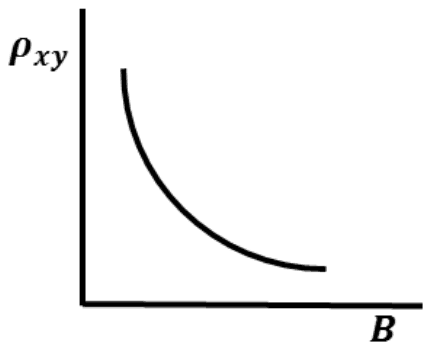
- D.
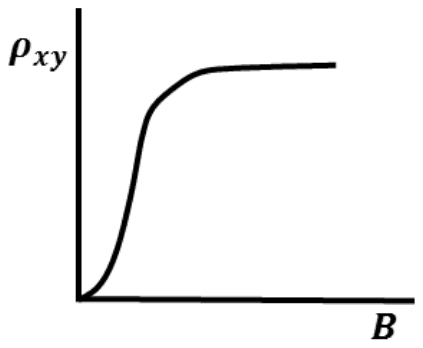
Answer: B
The Hall resistivity rises linearly with the magnetic field, the straight line through the origin in (B).
In steady state the Hall field balances the magnetic force on the carriers, giving \(E_{y} = v_{x}B = J_{x}B/(ne)\). So
\[ \rho_{xy} = \frac{E_{y}}{J_{x}} = \frac{B}{ne} \]
which is proportional to \(B\) and zero when there is no field. In a non-magnetic material there is no anomalous Hall contribution from a spontaneous magnetisation, so the line passes through the origin.
A constant (A) would mean a Hall signal at zero field; a falling curve (C) has the dependence upside down; and a curve that saturates into a plateau (D) resembles the quantum Hall or anomalous Hall behaviour, not the classical Hall effect asked about.
Post your comment
Please log in or register to post a comment.
Examination Categories
- SSC Exams
- Banking Exams
- Teaching Exams
- Civil Services Exams
- Railways Exams
- Engineering Recruitment Exams
- Defence Exams
- State Government Exams
- Police Exams
- Insurance Exams
- Nursing Exams
- Other Government Exams
- NRA CET
- PG Entrance Exams
- Campus Placement
- MBA Entrance Exams
- CUET and UG Entrance
- Judiciary Exams
- Regulatory Body Exams
- Software Development