
Discussion
For adsorption of a gas on a solid surface, the plot that represents Freundlich isotherm is
(x = mass of gas, m = mass of adsorbent, P = pressure)
- A.

- B.
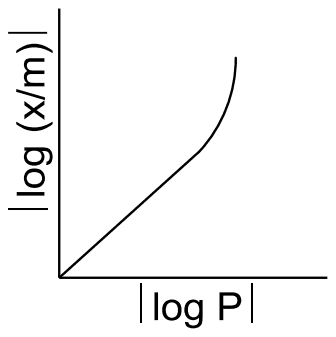
- C.

- D.
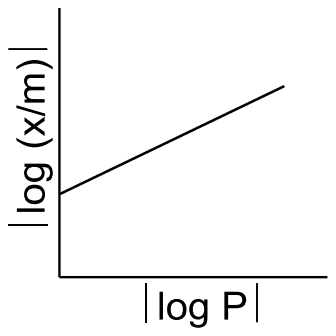
Answer: D
The Freundlich isotherm is plot (D).
The isotherm is \(x/m = kP^{1/n}\). Taking logarithms gives a straight line:
\[ \log\frac{x}{m} = \log k + \frac{1}{n}\log P \]
The line has a positive slope \(1/n\) and a positive intercept \(\log k\), which is what (D) shows. (A) levels off to a plateau, the shape of a Langmuir isotherm as the surface saturates, which is not a log-log line. (B) is a line through the origin that turns upward, and (C) has a negative slope, so neither fits the equation.
No comment is present. Be the first to comment.
Loading…
Post your comment
Please log in or register to post a comment.
Examination Categories
- SSC Exams
- Banking Exams
- Teaching Exams
- Civil Services Exams
- Railways Exams
- Engineering Recruitment Exams
- Defence Exams
- State Government Exams
- Police Exams
- Insurance Exams
- Nursing Exams
- Other Government Exams
- NRA CET
- PG Entrance Exams
- Campus Placement
- MBA Entrance Exams
- CUET and UG Entrance
- Judiciary Exams
- Regulatory Body Exams
- Software Development