
Discussion
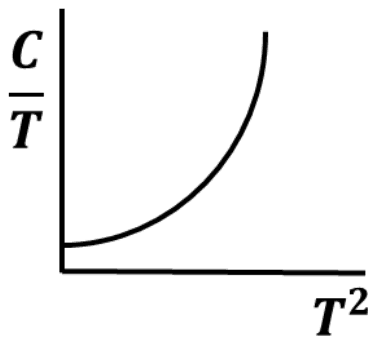
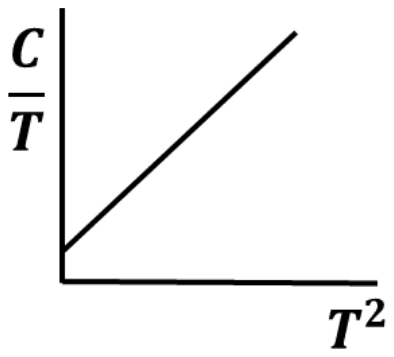
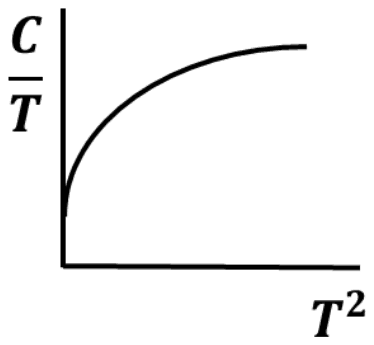
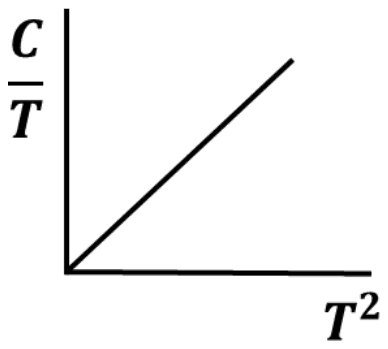
For a non-magnetic metal, which one of the following graphs best represents the behaviour of \(\frac{C}{T}\) vs. \(T^{2}\), where \(C\) is the heat capacity and \(T\) is the temperature?
- A.
- B.
- C.
- D.
Answer: B
The plot is a straight line with a positive intercept, graph (B).
At low temperature the heat capacity of a non-magnetic metal is the sum of an electronic term, linear in \(T\), and the Debye phonon term, proportional to \(T^{3}\):
\[ \begin{aligned} C &= \gamma T + \beta T^{3} \\ \frac{C}{T} &= \gamma + \beta T^{2} \end{aligned} \]
Against \(T^{2}\) this is a straight line of slope \(\beta\) (from the phonons) cutting the axis at \(\gamma\) (from the conduction electrons). This is how the two contributions are separated experimentally.
A line through the origin (D) would describe an insulator with no electronic term. The two curved graphs do not follow from either term.
Post your comment
Please log in or register to post a comment.
Examination Categories
- SSC Exams
- Banking Exams
- Teaching Exams
- Civil Services Exams
- Railways Exams
- Engineering Recruitment Exams
- Defence Exams
- State Government Exams
- Police Exams
- Insurance Exams
- Nursing Exams
- Other Government Exams
- NRA CET
- PG Entrance Exams
- Campus Placement
- MBA Entrance Exams
- CUET and UG Entrance
- Judiciary Exams
- Regulatory Body Exams
- Software Development