
Discussion
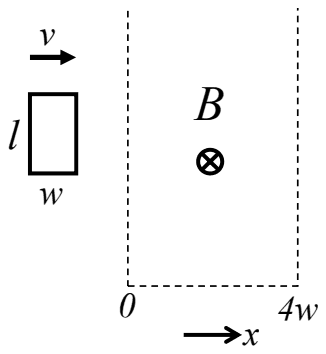
A rectangular loop of dimensions l and w moves with a constant speed of v through a region containing a uniform magnetic field B directed into the paper and extending a distance of 4w. Which of the following figures correctly represents the variation of emf (ε) with the position (x) of the front end of the loop?
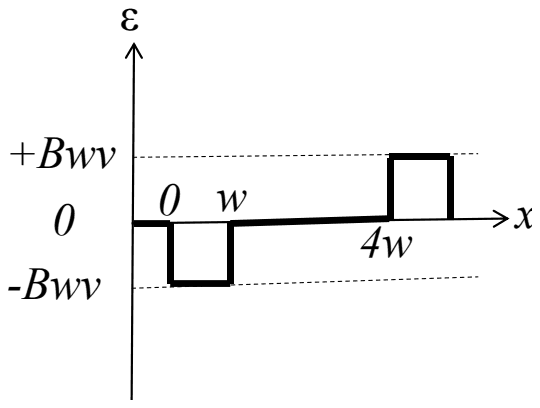
- A.
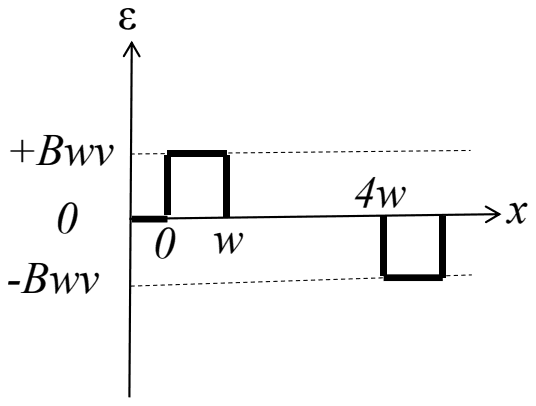
- B.
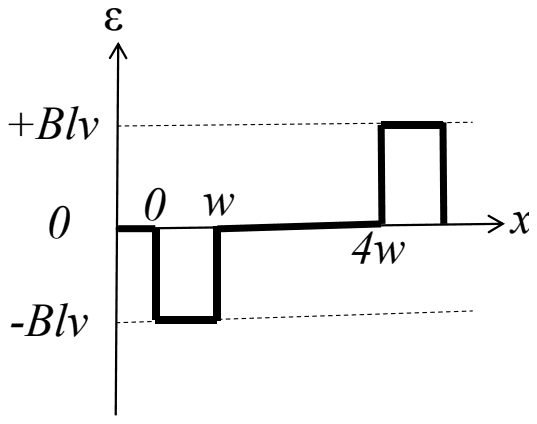
- C.
- D.
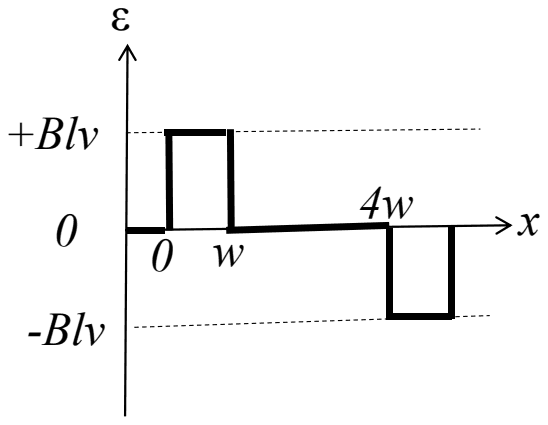
Answer: C
The correct graph is (C).
The side of length l is perpendicular to the motion, so while the loop is entering or leaving the field the flux changes at the rate \(Blv\), and the emf has magnitude \(Blv\). This rules out (A) and (B), which use \(Bwv\).
- From \(x = 0\) to \(w\) the loop enters and the inward flux grows, so \(\varepsilon = -d\Phi/dt = -Blv\).
- From \(w\) to \(4w\) the loop is wholly inside and the flux is constant, so \(\varepsilon = 0\).
- From \(4w\) to \(5w\) it leaves and the flux falls, so \(\varepsilon = +Blv\).
With inward flux counted positive, the pulse on entry is negative and on exit positive, as in (C); (D) has the signs reversed.
No comment is present. Be the first to comment.
Loading…
Post your comment
Please log in or register to post a comment.
Examination Categories
- SSC Exams
- Banking Exams
- Teaching Exams
- Civil Services Exams
- Railways Exams
- Engineering Recruitment Exams
- Defence Exams
- State Government Exams
- Police Exams
- Insurance Exams
- Nursing Exams
- Other Government Exams
- NRA CET
- PG Entrance Exams
- Campus Placement
- MBA Entrance Exams
- CUET and UG Entrance
- Judiciary Exams
- Regulatory Body Exams
- Software Development