
Discussion
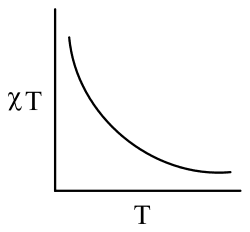
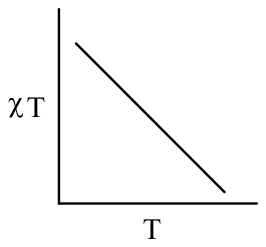
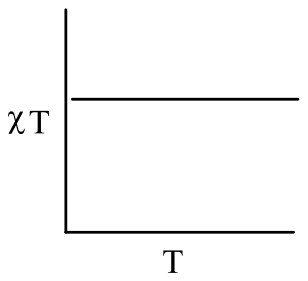
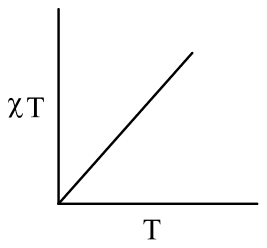
The plot of χT versus T (where χ is molar magnetic susceptibility and T is the temperature) for a paramagnetic complex which strictly follows Curie equation is
- A.
- B.
- C.
- D.
Answer: C
The correct plot is the horizontal straight line (C).
The Curie law says the molar susceptibility of an ideal paramagnet is inversely proportional to temperature:
\[ \chi = \frac{C}{T} \quad \Rightarrow \quad \chi T = C \]
The product χT is therefore a constant, independent of T, and a plot of χT against T is a horizontal line. Its height is the Curie constant, which fixes the effective magnetic moment.
A falling curve such as A is what χ itself does against T. A falling or rising straight line (B or D) would mean χT varies with temperature, as it does with antiferromagnetic or ferromagnetic coupling or a Curie-Weiss term, which the question excludes.
Post your comment
Please log in or register to post a comment.
Examination Categories
- SSC Exams
- Banking Exams
- Teaching Exams
- Civil Services Exams
- Railways Exams
- Engineering Recruitment Exams
- Defence Exams
- State Government Exams
- Police Exams
- Insurance Exams
- Nursing Exams
- Other Government Exams
- NRA CET
- PG Entrance Exams
- Campus Placement
- MBA Entrance Exams
- CUET and UG Entrance
- Judiciary Exams
- Regulatory Body Exams
- Software Development