
Discussion
Which one of the following is the correct graphical representation for functions, sin(x) and sin2(x) for \(0 \le x \le \pi\)?
- A.
- B.
- C.
- D.
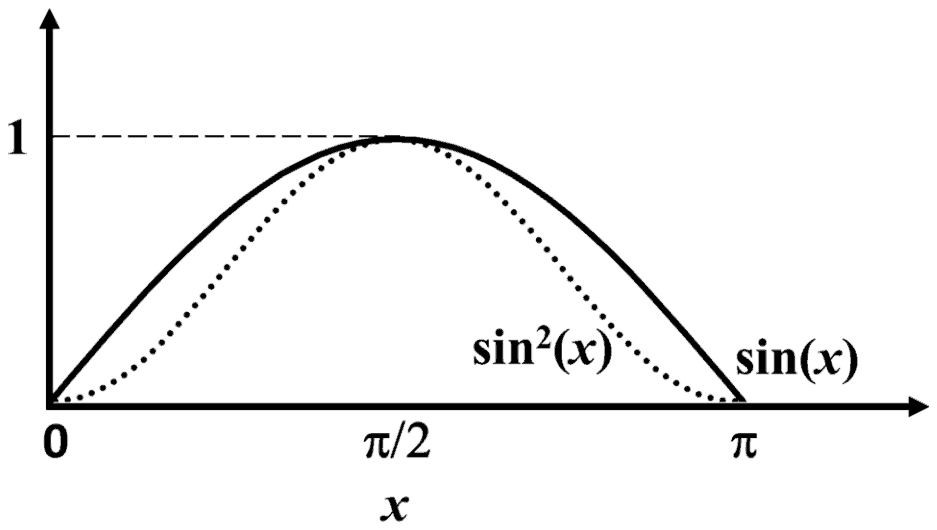
Answer: A
The correct pair of graphs is the one in option (A).
On \(0 \le x \le \pi\) the sine is between 0 and 1, and squaring a number between 0 and 1 makes it smaller. So \(\sin^{2}x \le \sin x\) everywhere, the two curves meet only at \(x = 0\), \(\pi/2\) and \(\pi\), and both reach exactly 1 at \(\pi/2\). Near 0 and \(\pi\) the square is much flatter, because \(\sin^{2}x \approx x^{2}\) there.
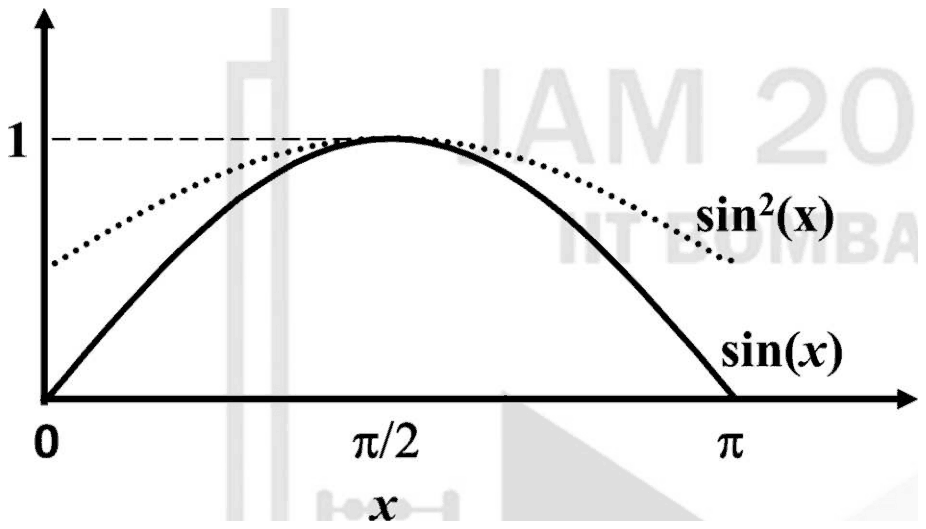
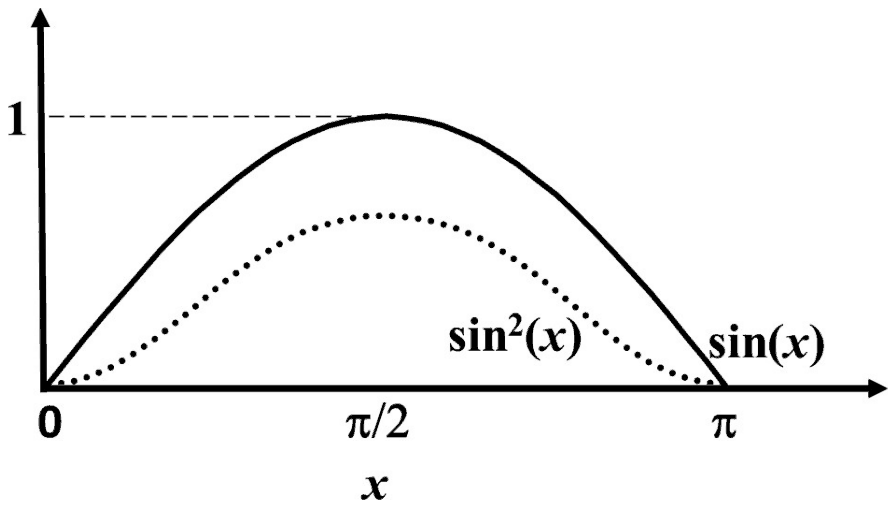
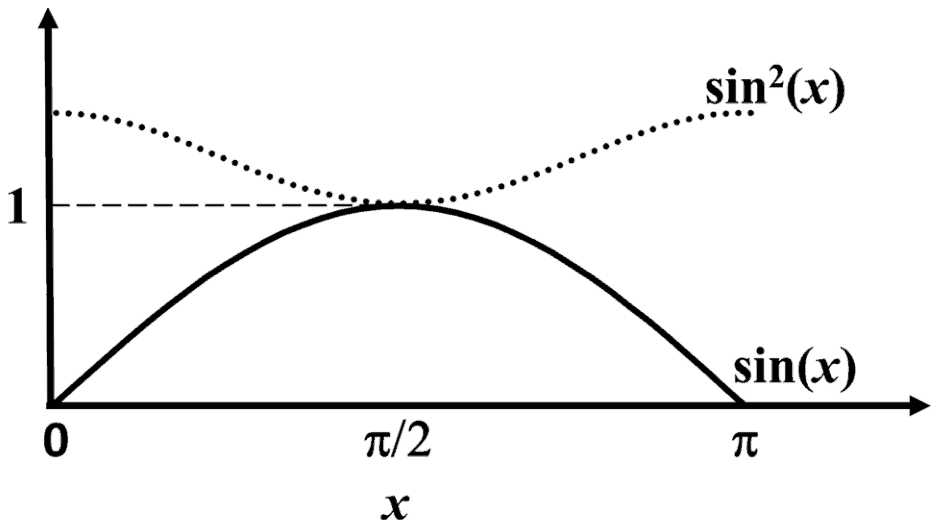
Option (B) shows \(\sin^{2}x\) starting above zero at \(x = 0\), but \(\sin^{2}0 = 0\). Option (C) has the square peaking below 1, but \(\sin^{2}(\pi/2) = 1\). Option (D) puts \(\sin^{2}x\) above \(\sin x\) and above 1, which can never happen.
Post your comment
Please log in or register to post a comment.
Examination Categories
- SSC Exams
- Banking Exams
- Teaching Exams
- Civil Services Exams
- Railways Exams
- Engineering Recruitment Exams
- Defence Exams
- State Government Exams
- Police Exams
- Insurance Exams
- Nursing Exams
- Other Government Exams
- NRA CET
- PG Entrance Exams
- Campus Placement
- MBA Entrance Exams
- CUET and UG Entrance
- Judiciary Exams
- Regulatory Body Exams
- Software Development