
Machine-translated by Google. Questions are authored in English.
Top

Data Interpretation Questions and Answers

Important Instructions
Direction for [ Question No: 21 To 21 ] :

Directions : Answer the following questions based on the information and diagram given below :

An automobile company has advertised for the appointment of trainee engineers in different disciplines. First the applications received are thoroughly scrutinized and good ones are called to the main centre of the company for two written tests and a viva. The written tests are of 2 hrs duration each.

The first written test E1 checks the general scientific background and the second written test E2 checks the basics of the discipline. Earlier all the candidates were required to appear in both E1 and E2 but only those who clear both were allowed to appear in the viva for final selection.

To minimize the cost, the company has decided to change the procedure. Now they want to conduct this exam in three stages.

In the first stage they may offer the candidate to sit in either written test (E1 or E2) and if s/he passes in that he/she will go for next stage in which company may take his/her other written test or viva. If he passes in this second stage, he will go for the remaining exam in third stage.

A candidate has to pass both the exams and viva for final selection. A candidate is rejected if s/he fails at any stage. The expenses are ₹ 500 per candidate for conducting each of E1, E2 or Viva (V). The following historical data for 100 candidates is available from previous selections.

21.

What is the percentage of candidates who are failing in second stage viva exam after clearing E2 exam in first stage ?

Three Venn diagrams of the selection results: the first stage of 100 candidates, the second stage for the 70 who cleared E1, and the second stage for the 60 who cleared E2, with the number of candidates in each region.

Exam Year(s)

Punjab Civil Service - 2021,

Answer: C

The percentage is 25%.

Use the diagram for the 60 candidates who cleared E2 in the first stage. Those who cleared the viva are 30 (cleared both) + 15 (cleared viva but failed E1) = 45.

\[ \begin{aligned} \text{failed viva} &= 60 - 45 = 15 \\ \text{percentage} &= \frac{15}{60} \times 100 = 25\% \end{aligned} \]

The 15 who failed are the 10 who cleared E1 but failed the viva and the 5 who failed both.

75% is the share who passed the viva. 66·7% is 40/60, the share who cleared E1, and 33·3% is 15/45, which compares the failures with those who passed instead of with all 60.

Please log in or register to report this question.
Direction for [ Question No: 22 To 22 ] :

Directions : BMI is defined as being the mass of a person (in kg) divided by the square of the height (in metres). The data about 5 persons has been given in the table below.

PersonHeight (m)Weight (kg)
A1·4545
B1·5050
C1·5555
D1·7060
E1·8070

Based on this data answer the questions below :

22.

Which of the following has the greatest BMI ?

Exam Year(s)

Punjab Civil Service - 2021,

Answer: C

C has the greatest BMI.

BMI is mass divided by the square of height:

\[ \begin{aligned} A &: 45 / 1.45^2 \approx 21.4 \\ B &: 50 / 1.50^2 \approx 22.2 \\ C &: 55 / 1.55^2 \approx 22.9 \\ D &: 60 / 1.70^2 \approx 20.8 \end{aligned} \]

E, not offered, gives \(70 / 1.80^2 \approx 21.6\).

The trap is to pick the heaviest person: D weighs more than C, but D's greater height, squared, more than cancels the extra weight. B is second, and A has the lowest weight but not the lowest BMI.

Please log in or register to report this question.

Direction for [ Question No: 23 To 24 ] :

Directions : Based on the information given below and diagram of an Airline’s trips to 6 cities from New Delhi in the year 2015 :

Distances from New Delhi by Air (bar chart, distance in kilometres)

CityDistance (km)
Ranchi1,000
Kolkata1,200
Panaji1,400
Pune1,200
Kavaratti1,800
Munnar2,000

A second chart, Number of Plane Trips from New Delhi to Ranchi, Kolkata, Panaji, Pune, Kavaratti, Munnar, plots the number of trips per month in 2015: none from January to March, a peak of 400 in May, and fewer towards the end of the year.

Information :

1. Due to some reason planes only made these trips before or after the January-March period.
2. The month of May offers the best weather conditions.
3. The easterly winds run at 2 km/hour east to west all year.
4. Planes on trips to Ranchi and Kolkata must push against the easterly winds.
5. Planes on trips to Panaji, Pune and Kavaratti are carried along by the easterly winds.
6. Planes on trips to Munnar cross the current and so experience no counter or favourable effect.

23.

How far is it from Ranchi to Munnar ?

Exam Year(s)

Punjab Civil Service - 2021,

Answer: D

The distance cannot be determined.

The bar chart gives each city's distance from New Delhi only: Ranchi 1,000 km and Munnar 2,000 km. Nothing in the chart or the information list says in which direction each city lies from New Delhi, or the angle between the two routes.

Two distances from a common point fix a third distance only when the directions are known. 3,000 km would hold only if the two cities lay on opposite sides of New Delhi on one straight line, and 2,000 km is just Munnar's distance from New Delhi. 800 km does not follow from the data either.

Please log in or register to report this question.

24.

Taking account of the distances and the winds, if a plane were to fly from New Delhi to Kolkata (to and fro) and another one from New Delhi to Pune (to and fro) at a constant speed, which trip would you expect to be completed quicker ? (No stoppage)

Exam Year(s)

Punjab Civil Service - 2021,

Answer: B

Both trips would take the same amount of time.

The chart puts Kolkata and Pune at the same distance from New Delhi, 1,200 km. A plane to Kolkata pushes against the easterly wind on the way out and is carried by it on the way back. A plane to Pune is carried by the wind on the way out and pushes against it on the way back.

So each round trip is 2,400 km with one leg into the 2 km/hour wind and one leg with it, at the same constant speed. The two trips are identical in every factor that affects time.

Choosing either city alone looks at only one leg of its round trip. 'Cannot be determined' is wrong because the distances and the wind effect are both given.

Please log in or register to report this question.

Direction for [ Question No: 25 To 26 ] :

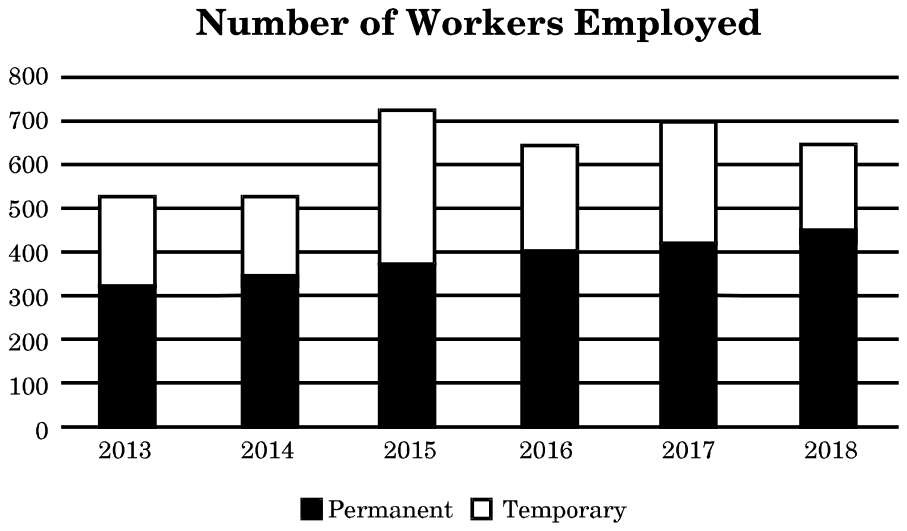
Directions : The following bar diagram displays the number of workers employed in a manufacturing company for the last 6 years. On all workdays, the permanent workers work 10 hours while the temporary workers work 6 hours. One year has 300 workdays. Annual workhours for a person for a year is defined as the total number of hours of work put in by that person that year. Similarly, the annual workhours for a workforce, e.g., all workers, is the total number of hours of work put in together by all people in the workforce that year.

Answer Questions no. 77 - 80 based on the above information.

25.

Which year did the company employ the minimum number of temporary employees ?

Stacked bar chart of permanent and temporary workers employed each year from 2013 to 2018, on a scale of 0 to 800

Exam Year(s)

Punjab Civil Service - 2018,

Answer: B

The fewest temporary employees were employed in 2014.

In the stacked bar chart, the temporary workers are the white upper part of each bar, from the top of the black (permanent) part to the top of the bar. Reading the bars: in 2013 the bar rises from about 325 to about 525 (about 200 temporary), in 2014 from about 350 to about 525 (about 175), in 2016 from about 400 to about 645 (about 245), and in 2018 from about 450 to about 650 (about 200).

2014's white segment is the shortest, about 175 workers. 2013 and 2018 have about 200 each, and 2016 about 245, so those options are wrong.

Please log in or register to report this question.

26.

Which year did the company's permanent workers contribute the minimum percentage of the total annual workhours of the entire workforce ?

Stacked bar chart of permanent and temporary workers employed each year from 2013 to 2018, on a scale of 0 to 800

Exam Year(s)

Punjab Civil Service - 2018,

Answer: C

The permanent workers' share of workhours was lowest in 2015.

The permanent workers' share is 10P / (10P + 6T), with P and T read from the chart:

\[ \begin{aligned} 2013 &: 3250/4450 \approx 73\% \\ 2014 &: 3500/4550 \approx 77\% \\ 2015 &: 3750/5850 \approx 64\% \\ 2016 &: 4000/5470 \approx 73\% \end{aligned} \]

2015 stands out because it had by far the most temporary workers, about 350, nearly as many as its 375 permanent workers, so the temporary workers' hours took a much larger share that year than in 2013, 2014 or 2016.

Please log in or register to report this question.

Direction for [ Question No: 27 To 30 ] :

Directions : Following pie-chart gives the number of women in different categories who had babies in a government hospital in a city last year :

Age-wise number of women who had babies (values as labelled on the pie chart)

Age groupNumber of women
20 - 24450
25 - 29350
30 - 34150
35 - 4050

Answer Questions no. 73 - 76 based on the above information.

27.

What is the percentage of women aged between 25 - 34 ?

Exam Year(s)

Punjab Civil Service - 2018,

Answer: C

Women aged 25 - 34 make up 50 per cent.

The pie chart gives 450 women aged 20 - 24, 350 aged 25 - 29, 150 aged 30 - 34 and 50 aged 35 - 40, a total of 1000.

\[ \begin{aligned} 350 + 150 &= 500 \\ 500 / 1000 &= 50\% \end{aligned} \]

35 is the share of the 25 - 29 group alone, and 15 the share of the 30 - 34 group alone. 80 adds the 20 - 24 group to the 25 - 29 group instead of the two groups asked about.

Please log in or register to report this question.

28.

In the group of women aged 25 - 34, 25% were from the age group 27 - 29. What is the number of women aged 27 years or above who had babies in that hospital last year ?

Exam Year(s)

Punjab Civil Service - 2018,

Answer: D

The number aged 27 or above is 325.

The 25 - 34 group has 350 + 150 = 500 women, and 25% of them, 125, are aged 27 - 29. Women aged 27 or above are those aged 27 - 29, plus everyone in the 30 - 34 and 35 - 40 groups:

\[ 125 + 150 + 50 = 325 \]

550 counts the whole of the 25 - 34 group plus the 35 - 40 group, instead of only those aged 27 and above. 200 counts only the women aged 30 and above and leaves out the 27 - 29 group. 425 does not match any correct grouping of the ages.

Please log in or register to report this question.

29.

In the group of women aged 30 - 34, 60% were aged 30. Among all women who had babies in that hospital last year, what percentage was aged 31 or above ?

Exam Year(s)

Punjab Civil Service - 2018,

Answer: A

The percentage aged 31 or above is 11.

Of the 150 women aged 30 - 34, 60% (90 women) were 30, so 60 were aged 31 - 34. Adding the 50 women aged 35 - 40:

\[ \begin{aligned} 60 + 50 &= 110 \\ 110 / 1000 &= 11\% \end{aligned} \]

14 counts the 90 women aged exactly 30 with the 35 - 40 group, the opposite of what is asked. 20 takes the whole 30 - 34 group plus the 35 - 40 group. 13.5 does not correspond to the data.

Please log in or register to report this question.

30.

Among the women who gave birth in that hospital last year, the percentage of women who had their first child was :
80% for age group 20 - 24,
60% for age group 25 - 29,
30% for age group 30 - 34, and
2% for age group 35 - 40.

In the whole cohort, what percentage of women had their first child ?

Exam Year(s)

Punjab Civil Service - 2018,

Answer: C

The percentage having their first child was 61.6.

Apply each group's percentage to the number of women in it and add:

\[ \begin{aligned} 0.80 \times 450 &= 360 \\ 0.60 \times 350 &= 210 \\ 0.30 \times 150 &= 45 \\ 0.02 \times 50 &= 1 \end{aligned} \]

That is 616 first-time mothers out of 1000 women, or 61.6%.

43 is the simple average of the four percentages, (80 + 60 + 30 + 2)/4, which ignores that the groups differ greatly in size. 52.9 and 65.8 do not match the weighted total of 616.

Please log in or register to report this question.

Loading…

Topics

    No topic!
Tags: Data Interpretation Questions and Answers || DI MCQ Questions || Data Analysis Quantitative Aptitude || Data Interpretation GK Questions || DI on Quantitative Aptitude