
Machine-translated by Google. Questions are authored in English.
Top

Data Interpretation Questions and Answers

Important Instructions
161.

Following is the record of the performance of a football team for the seven tournaments played in a year

TournamentMatches wonMatch LostTotal matches played
1538
2448
3527
4639
5426
6336
7246

What percent of the matches did the team win overall?

Exam Year(s)

ISRO Assistant - 2023,

Answer: A

The team won 58% of its matches.

Add the matches won and the total played across the seven tournaments:

\[ \begin{aligned} \text{won} &= 5+4+5+6+4+3+2 = 29 \\ \text{played} &= 8+8+7+9+6+6+6 = 50 \end{aligned} \]

\(29/50 = 58\%\). Averaging the seven separate win percentages would give a slightly different figure, because the tournaments have different numbers of matches. 52%, 75% and 80% do not match the totals.

Please log in or register to report this question.
162.

The following Pie chart represents the vehicles used by office goers to reach their office.

Vehicles
Walk20
Car100
Bus80
Bike120

What is the central angle corresponding to the office goers who use four-wheelers for their commute ?

Exam Year(s)

Kerala PSC KAS - 2025,

Answer: A

The central angle is 202.5°.

The chart totals \(20 + 100 + 80 + 120 = 320\) office goers. The four-wheelers are cars and buses, \(100 + 80 = 180\) people.

\[ \begin{aligned} \text{angle} &= \frac{180}{320} \times 360^\circ \\ &= 202.5^\circ \end{aligned} \]

Counting only cars would give \(\frac{100}{320} \times 360^\circ = 112.5^\circ\), which is not an option, a sign that buses belong in the four-wheeler group. 203° to 204° are rounding traps around the exact value.

Please log in or register to report this question.

163.

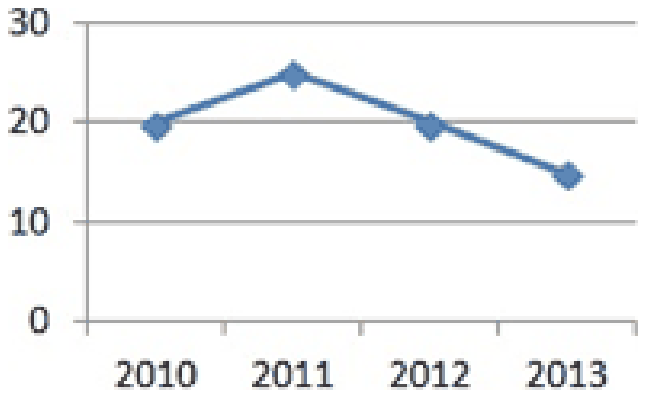
Salary (in thousands) of Deepak for the given period are shown in graph:-

Line graph of salary in thousands for 2010 to 2013, with points at about 20, 25, 20 and 15

By what percentage has Deepak’s salary decreased in 2013 over 2010?

Exam Year(s)

MP Lab Technician - 2015,

Answer: B

The salary fell by 25%.

Reading the graph, Deepak's salary was 20 thousand in 2010 and 15 thousand in 2013, a fall of 5 thousand.

\[ \begin{aligned} \text{decrease} &= \frac{20 - 15}{20} \times 100 \\ &= 25\% \end{aligned} \]

The base of a percentage change is the earlier value, 2010's 20 thousand.

33.33% is what you get by dividing the fall by the 2013 value, 15, instead of 20. 20% would be the fall from 2011 to 2012 (25 to 20). 'None of these' is wrong because 25% is offered.

Please log in or register to report this question.

164.

Angular component of part B in the given figure is

The figure is a pie chart divided into three parts labelled with these values:

PartValue
A62
B31
C9

Exam Year(s)

MPPSC Forest Service - 2024,

Answer: D

The angle of part B is about 109°.

The whole circle, 360°, represents the total of the three parts, 62 + 31 + 9 = 102. Part B's share is

\[ \begin{aligned} \theta_{B} &= \frac{31}{102} \times 360^{\circ} \\ &\approx 109.4^{\circ} \approx 109^{\circ} \end{aligned} \]

111.6° (option B, about 111°) would come from treating the values as percentages of 100, which they are not, since they total 102. 108° and 113° do not match the share either.

Please log in or register to report this question.

165.

The following pie-chart shows the monthly expenses and savings of a family. If the expenditure on the house rent is ₹18,000 per month, then the sum of the expenditure on food and transport is :

HeadShare
Food30%
House rent15%
Savings20%
Education12%
Clothes5%
Transport8%
Others10%

Exam Year(s)

MPPSC State Service - 2024, MPPSC Forest Service - 2024,

Answer: D

Food and transport together cost ₹45,600.

House rent is 15% of the total and equals ₹18,000, so the whole monthly budget is:

\[ \begin{aligned} \text{total} &= \frac{18000}{0.15} = 120000 \\ \text{food + transport} &= (30\% + 8\%) \times 120000 \\ &= 0.38 \times 120000 = 45600 \end{aligned} \]

₹36,000 is food alone (30%); ₹45,000 and ₹36,600 do not correspond to the shares in the chart.

Please log in or register to report this question.

166.

The following pie-chart shows the expenditure details of a family. If the total expenditure on food is ₹ 4800, then how much is the total expenditure on all the items ?

ItemShare
Food30%
Rent25%
Saving18%
Transport12%
Retail10%
Clothes5%

Exam Year(s)

MPPSC State Service - 2023, MPPSC Forest Service - 2023,

Answer: B

The total expenditure is ₹ 16,000.

Food is 30% of the total, and it amounts to ₹ 4800:

\[ \begin{aligned} 0.30 \times T &= 4800 \\ T &= \frac{4800}{0.30} = 16{,}000 \end{aligned} \]

A quick check: the six shares (30 + 25 + 18 + 12 + 10 + 5) add up to 100%, so the chart covers the whole budget. ₹ 15,000 would make food 32%, and ₹ 18,000 would make it about 26.7%, so neither fits the 30% shown.

Please log in or register to report this question.

Loading…
Tags: Data Interpretation Questions and Answers || DI MCQ Questions || Data Analysis Quantitative Aptitude || Data Interpretation GK Questions || DI on Quantitative Aptitude