
Machine-translated by Google. Questions are authored in English.
Top

Data Interpretation Questions and Answers

Important Instructions
91.

The line chart given below shows the number of calculator sold by five shops.

Line chart of calculators sold by five shops: S1 20, S2 50, S3 75, S4 125 and S5 100.

What is the average number of calculators sold by all shops?

Exam Year(s)

DSSSB - 2023,

Answer: B

The line chart gives the numbers of calculators sold by the five shops as 20, 50, 75, 125 and 100. Their sum is 20 + 50 + 75 + 125 + 100 = 370, and the average over the five shops is 370 / 5 = 74. So the answer is 74, option (B). The values 76, 72 and 78 would need totals of 380, 360 and 390, which do not match the chart, and the point of 125 for the fourth shop is the highest while 20 for the first is the lowest.

Please log in or register to report this question.
92.

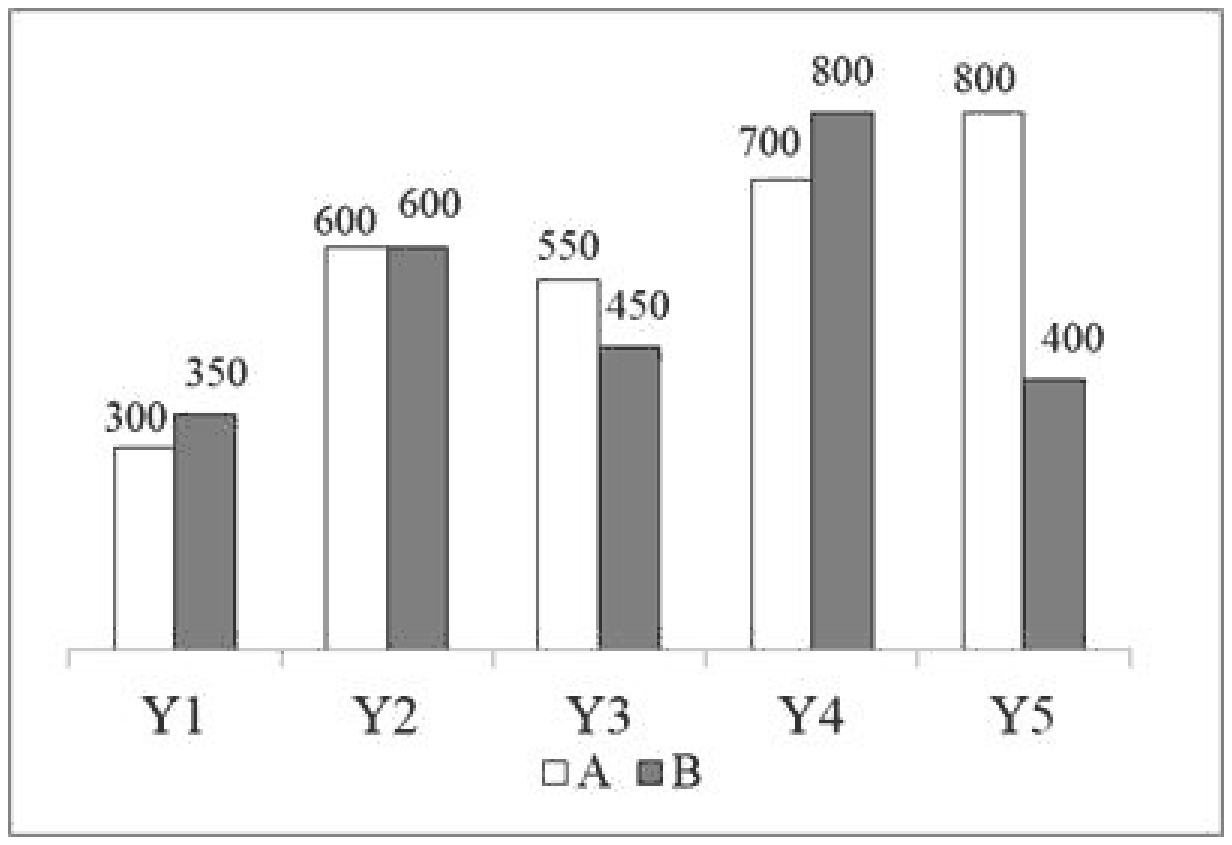
The bar graph given below shows the production of truck by two companies in five years.

Bar graph of trucks produced by companies A and B: Y1 300 and 350, Y2 600 and 600, Y3 550 and 450, Y4 700 and 800, Y5 800 and 400.

Which of the following statement is NOT correct?

I. The production of truck by A in year Y1 is 50 percent of the production of truck by B in year Y2
II. The ratio of the total production of truck by B in year Y4 and Y5 to the total production of truck by A in Y2 and Y3 is 24 : 23

Exam Year(s)

DSSSB - 2023,

Answer: D

Statement I says A's production in Y1 is 50 percent of B's production in Y2. A produced 300 in Y1 and B produced 600 in Y2, and 300 is 50 percent of 600, so statement I is correct. Statement II says the ratio of B's total in Y4 and Y5 to A's total in Y2 and Y3 is 24 : 23. B produced 800 + 400 = 1200 and A produced 600 + 550 = 1150, and 1200 : 1150 = 24 : 23, so statement II is also correct. The question asks for the statement that is NOT correct, and neither statement is wrong, so the answer is Neither I nor II, option (D).

Please log in or register to report this question.

93.

This given pie-chart indicates the distribution of students who appeared for board examination from schools A, B, C, D and E in 2020. Study the pie-chart and answer the question that follows.

Pie chart titled Distribution of students appeared in Board examination from schools A, B, C, D and E in 2020: A 22 per cent, B 16 per cent, C 20 per cent, D 17 per cent, E 25 per cent

Total number of students appeared = 2400

The ratio of boys and girls appeared from school A is 5 : 6 and 60 % of the students who appeared from school E are girls. Total number of girls who appeared from schools A and E exceeds \(\frac{2}{3}\) of the total number of students who appeared from school B and D by \(x\). The value of \(x\) lies between:

Exam Year(s)

DSSSB - 2023,

Answer: C

The value of x is 120, which lies between 115 and 125. The total is 2400 students. From the pie chart, school A has 22 % = 528, B has 16 % = 384, D has 17 % = 408 and E has 25 % = 600.

\[ \text{Girls in A} = \frac{6}{11} \times 528 = 288 \]

\[ \text{Girls in E} = 0.60 \times 600 = 360 \]

So the girls from A and E number 288 + 360 = 648. The students from B and D number 384 + 408 = 792, and two thirds of that is 528.

\[ x = 648 - 528 = 120 \]

The other ranges, 95 to 105, 105 to 115 and 125 to 135, do not contain 120.

Please log in or register to report this question.

94.

The following graph shows the sale of few items of a garment company for three months.

3-D bar chart of monthly sales in million units. January: shirt 3, trouser 5, coat 7, T-shirt 4, jacket 6. March: 8, 9, 10, 6, 7. May: 12, 14, 11, 10, 13

What is the percentage of sale of shirts in January over the total sales in the month of January?

Exam Year(s)

DSSSB - 2023,

Answer: B

The percentage is 12%.

The January sales (blue bars) are shirt 3, trouser 5, coat 7, T-shirt 4 and jacket 6, which total 25 million units. Shirts are 3 of those.

\[ \frac{3}{25}\times100=12\% \]

20%, 17% and 25% would need a different shirt figure or total.

The graph is a three-dimensional bar chart with three rows of bars: blue for January, orange for March and grey for May. Only the blue bars are needed here. The values 3, 5, 7, 4 and 6 add to 25, and the share of shirts is 3 out of 25, which is 12%.

Please log in or register to report this question.
95.

Study the given pie chart and answer the following question.

Breakup (percentage-wise) of amount spent on different sports in 2021 in a school

SportShare of the amount spent
Cricket22.50%
Golf12%
Others12.50%
Basketball15%
Football18%
Hockey20%

Amount spent on cricket = ₹ 18,000

If the total amount spent on Basketball and Hockey is ₹ x more than the total amount spent on Football and Golf, then the value of x lies between:

Exam Year(s)

DSSSB TGT - 2023,

Answer: B

The value of \(x\) lies between 3,800 and 4,200; it is exactly 4,000. Cricket is 22.5% and costs ₹ 18,000, so the total is \(\frac{18000}{0.225} = 80000\). Basketball and Hockey together are \(15\% + 20\% = 35\%\), which is 28,000. Football and Golf together are \(18\% + 12\% = 30\%\), which is 24,000. \[ x = 28000 - 24000 = 4000 \] The difference of 5 percentage points of 80,000 is 4,000, so only the interval 3,800 to 4,200 contains it.

Please log in or register to report this question.

96.

Study the given graph and answer the following question.

Production of rice by states A, B and C during 2018 to 2020 (in lakh tonnes)

State201820192020
A450500600
B550470650
C620600720

The average production of rice (per year) by states A, B and C in 2018 is what percentage less than the production of rice by state C in 2020?

Exam Year(s)

DSSSB TGT - 2023,

Answer: C

The average production is 25% less than C's 2020 production. State production in 2018: A 450, B 550, C 620, so the average is \[ \frac{450 + 550 + 620}{3} = \frac{1620}{3} = 540 \] State C in 2020 produced 720 lakh tonnes. \[ \begin{aligned} \frac{720 - 540}{720}\times 100 &= \frac{180}{720}\times 100 \\ &= 25\% \end{aligned} \] Dividing the same difference of 180 by 540 instead of 720 would give \(33\frac{1}{3}\)%, which is the wrong base, since the question compares with C's 2020 production; 18% and 20% do not come out of these numbers.

Please log in or register to report this question.

97.

Consider the percentage of students of different schools involved in various activities.

School→
Activities↓
SSBSCSDS
Games25302023
Music15252520
Academic30202515
Dance25152230

The difference in average number of students in various activities of CS and the average number of students in dance is ________.

Exam Year(s)

DSSSB PGT - 2023,

Answer: A

The difference is 0. For CS, the average over the four activities is (20 + 25 + 25 + 22) / 4 = 92 / 4 = 23. For dance, the average over the four schools is (25 + 15 + 22 + 30) / 4 = 92 / 4 = 23. The difference is 23 - 23 = 0.

2, 3 and 5 would result only from misreading a cell in the table.

Please log in or register to report this question.

98.

The pie chart presents the percentage contribution of different macronutrients to a typical 2,000 kcal diet of a person.

Macronutrient energy contribution (pie chart): Carbohydrates 35%, Proteins 20%, Unsaturated fat 20%, Saturated fat 20%, Trans fat 5%.

The typical energy density (kcal/g) of these macronutrients is given in the table.

MacronutrientEnergy density (kcal/g)
Carbohydrates4
Proteins4
Unsaturated fat9
Saturated fat9
Trans fat9

The total fat (all three types), in grams, this person consumes is

Exam Year(s)

GATE CS - 2024, GATE AE - 2024, GATE AG - 2024,

Answer: C

The person eats 100 g of fat.

The three fats together supply 20% + 20% + 5% = 45% of the 2,000 kcal, and every fat gives 9 kcal per gram:

\[ \begin{aligned} \text{Fat energy} &= 0.45 \times 2000 = 900\ \text{kcal} \\ \text{Fat mass} &= 900 / 9 = 100\ \text{g} \end{aligned} \]

44.4 g is the saturated (or unsaturated) fat alone, \(400/9\). 77.8 g is \(700/9\), which uses the 35% carbohydrate share by mistake. 3,600 multiplies the fat energy by 4 instead of dividing by 9.

Please log in or register to report this question.

99.

A 4 × 4 digital image has pixel intensities (\(U\)) as shown in the figure. The number of pixels with \(U \le 4\) is:

0102
4733
5544
6732

Exam Year(s)

GATE Chemistry - 2025, GATE AE - 2025,

Answer: C

There are 11 pixels with \(U \le 4\).

Count row by row the entries that are 4 or less:

  • Row 1 (0, 1, 0, 2): all 4
  • Row 2 (4, 7, 3, 3): 4, 3, 3, that is 3
  • Row 3 (5, 5, 4, 4): the two 4s, that is 2
  • Row 4 (6, 7, 3, 2): 3 and 2, that is 2

The total is 4 + 3 + 2 + 2 = 11. Counting only values strictly below 4 drops the three 4s and gives 8, which is the trap in option B. 9 and 3 miss further entries.

Please log in or register to report this question.

100.

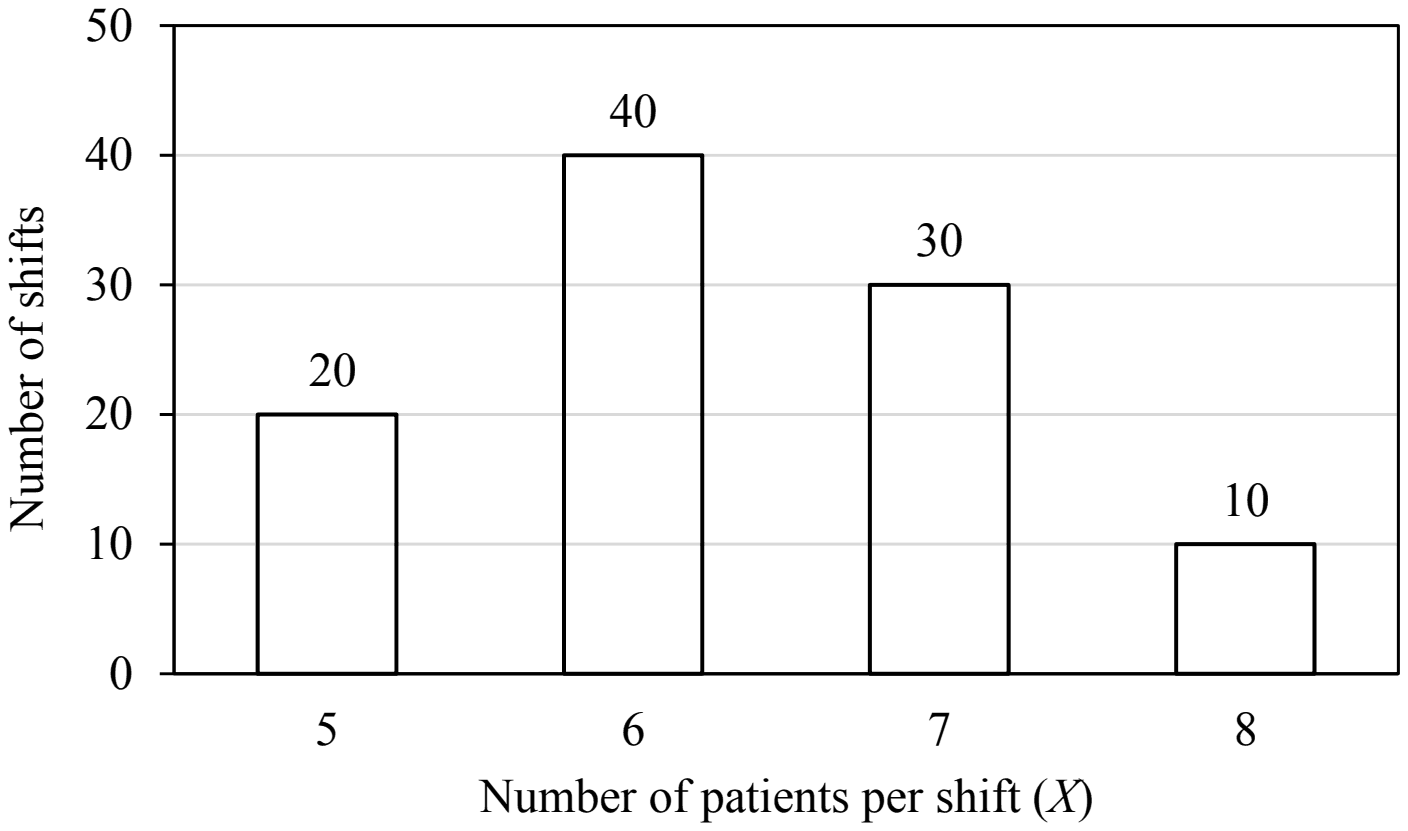
The number of patients per shift (\(X\)) consulting Dr. Gita in her past 100 shifts is shown in the figure. If the amount she earns is ₹ 1000(\(X - 0.2\)), what is the average amount (in ₹) she has earned per shift in the past 100 shifts?

Note: The figure shown is representative.

Bar chart of number of shifts against number of patients per shift X: 20 shifts at X=5, 40 shifts at X=6, 30 shifts at X=7, 10 shifts at X=8

Exam Year(s)

GATE AE - 2025,

Answer: A

She earned ₹ 6,100 per shift on average.

The mean number of patients per shift, weighted by the number of shifts, is

\[ \begin{aligned} \bar{X} &= \frac{5(20) + 6(40) + 7(30) + 8(10)}{100} \\ &= \frac{100 + 240 + 210 + 80}{100} = 6.3 \end{aligned} \]

The earning is linear in X, so the average earning is \(1000(\bar{X} - 0.2) = 1000(6.1) = 6100\) rupees. 6,300 is the mean number of patients times 1000, forgetting to subtract the 0.2 per shift. Because the earning rule is linear, averaging X first and averaging the earnings shift by shift give the same 6,100.

Please log in or register to report this question.

Loading…
Tags: Data Interpretation Questions and Answers || DI MCQ Questions || Data Analysis Quantitative Aptitude || Data Interpretation GK Questions || DI on Quantitative Aptitude