
Which one of the following figures represents the qualitative variation of absolute deceleration \(\left|\frac{dV}{dt}\right|\) with altitude \(h\) (measured from the mean sea level) for a space vehicle undergoing a ballistic entry into the Earth’s atmosphere?
GATE AE - 2023,
Answer: D
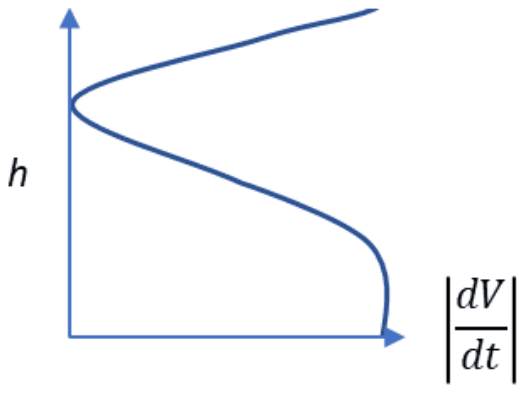
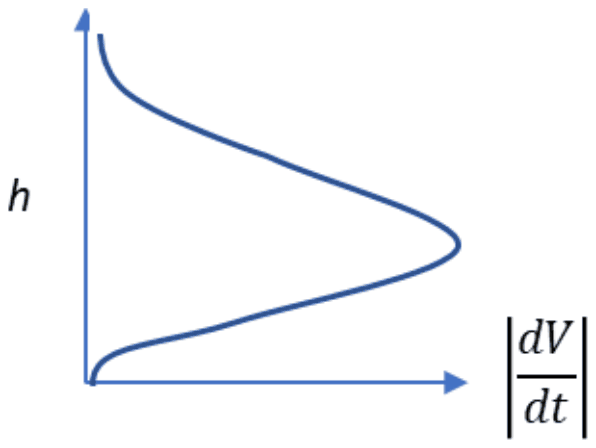
The correct variation is graph (D): deceleration is near zero high up, rises to a single peak at an intermediate altitude and falls again lower down.
In a ballistic entry, deceleration is the drag force per unit mass, proportional to \(\rho V^{2}\). High in the atmosphere the density is tiny, so the deceleration is negligible even though the vehicle is very fast. As it descends, density grows exponentially and the deceleration rises sharply. But the drag also bleeds off speed, and lower down \(V^{2}\) falls faster than \(\rho\) grows, so the deceleration passes a maximum and decreases. Allen and Eggers’ analysis shows this peak occurs at a definite altitude, with a maximum value independent of the vehicle’s ballistic coefficient.
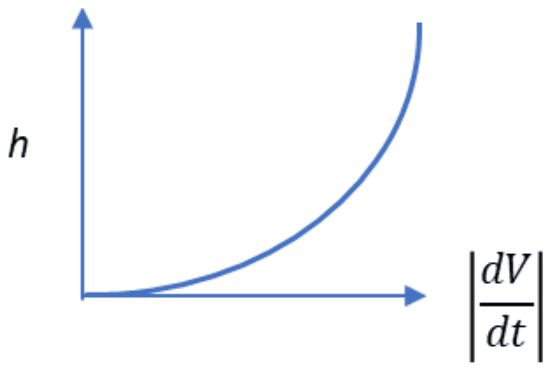
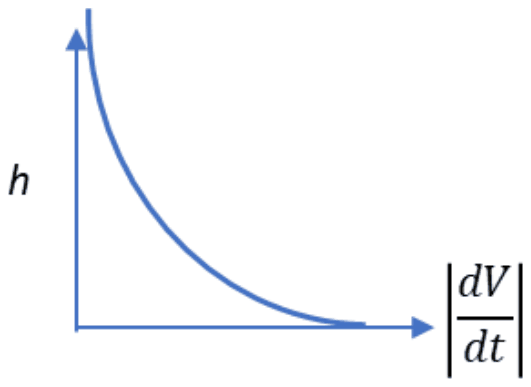
Graphs (B) and (C) are monotonic, missing the peak. Graph (A) shows a large deceleration at the very highest altitudes, where the air is too thin to slow the vehicle, and its largest value at sea level, by which time most of the speed has gone.
Please log in or register to report this question.