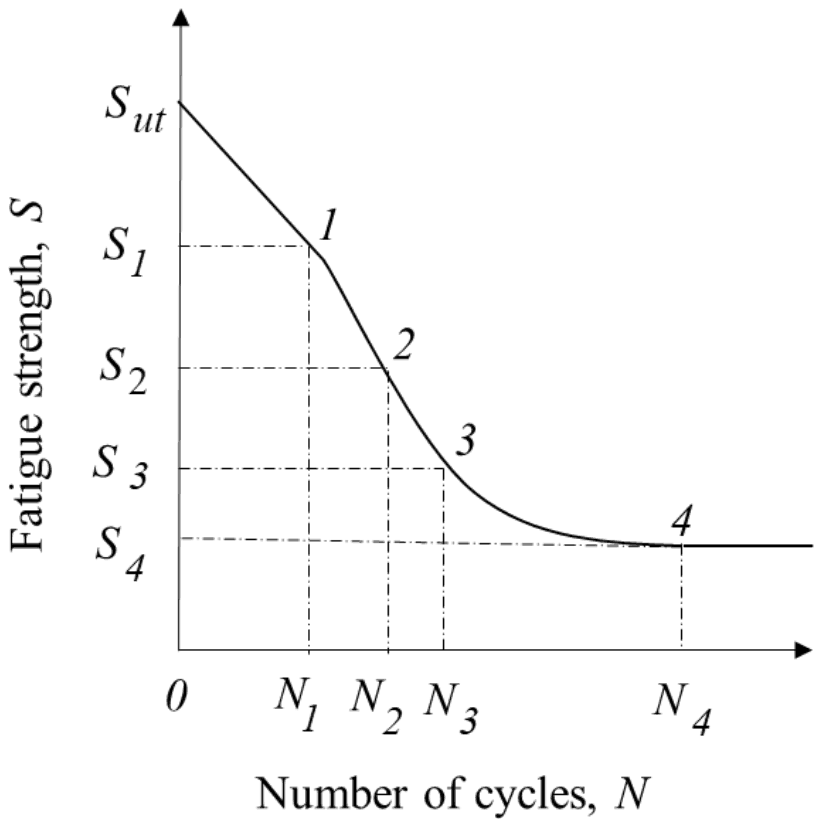
In the context of fatigue failure, the S-N curve of a material represents the relation between:
DSSSB - 2023,
Answer: C
The S-N curve shows the relation between stress amplitude and the number of cycles to failure. It is plotted from fatigue tests at different stress levels and is used to find the endurance limit. The stress intensity factor belongs to fracture mechanics, strain amplitude is used in low cycle fatigue (the strain-life curve), and elastic modulus is a constant property of the material, so the other options are wrong.
On the S-N curve the stress amplitude is plotted against the number of cycles on a logarithmic axis, and for steels the curve flattens at the endurance limit.
Please log in or register to report this question.