
Machine-translated by Google. Questions are authored in English.
Top

Interpretation of Data Questions and Answers

Direction for [ Question No: 1 To 2 ] :

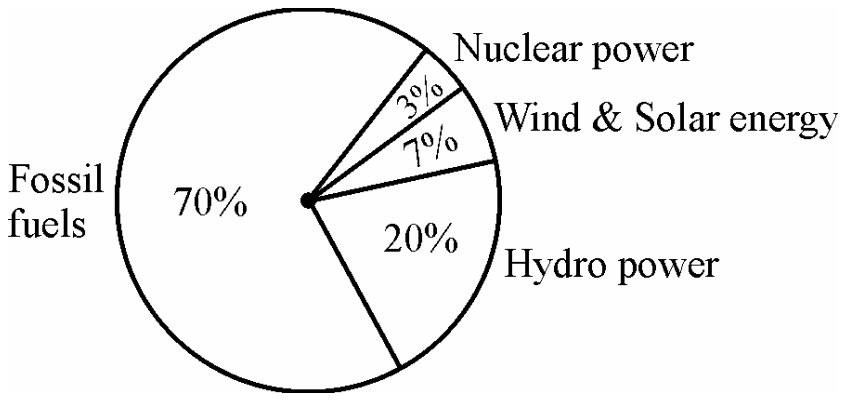
The total electricity generation in a country is 97 GW. The contribution of various energy sources is indicated in percentage terms in the Pie Chart given below ;

Pie chart of electricity generation by source: fossil fuels 70 per cent, hydro power 20 per cent, wind and solar energy 7 per cent, nuclear power 3 per cent.

1.

What is the contribution of wind and solar power in absolute terms in the electricity generation ?

Exam Year(s)

UGC NET - 2012,

Answer: A

The contribution of wind and solar power is 6.79 GW. From the pie chart, wind and solar energy supply 7 per cent of the total of 97 GW, so


\[ \frac{7}{100} \times 97 = 6.79\ \text{GW} \]

The value 9.7 GW is 10 per cent of the total, 19.4 GW is 20 per cent, which is the share of hydro power, and 29.1 GW is 30 per cent, so these come from reading the wrong sector or the wrong percentage. The answer is 6.79 GW.

Please log in or register to report this question.

2.

What is the contribution of renewable energy sources in absolute terms in the electricity generation ?

Exam Year(s)

UGC NET - 2012,

Answer: B

The contribution of the renewable sources is 26.19 GW. In the pie chart the renewable sources are hydro power at 20 per cent and wind and solar energy at 7 per cent, which together make 27 per cent of the 97 GW total:


\[ \frac{27}{100} \times 97 = 26.19\ \text{GW} \]

Nuclear power and fossil fuels are not renewable. The value 29.1 GW would be 30 per cent, which adds the 3 per cent of nuclear power, 67.9 GW is the share of fossil fuels at 70 per cent, and 97 GW is the whole generation. The answer is 26.19 GW.

Please log in or register to report this question.

Direction for [ Question No: 3 To 8 ] :

On the basis of the data given in the following table, give answers to questions :

Government Expenditures on Social Services (As percent of total expenditure)

Sl. No.Items2007-082008-092009-102010-11
Social Services11.0612.9413.0614.02
(a)Education, sports & youth affairs4.024.043.964.46
(b)Health & family welfare2.051.911.902.03
(c)Water supply, housing, etc.2.022.312.202.27
(d)Information & broadcasting0.220.220.200.22
(e)Welfare to SC/ST & OBC0.360.350.410.63
(f)Labour and employment0.270.270.220.25
(g)Social welfare & nutrition0.820.720.791.06
(h)North-eastern areas0.001.561.501.75
(i)Other social services1.291.551.871.34
Total Government expenditure100.00100.00100.00100.00

3.

How many activities in the social services are there where the expenditure has been less than 5 percent of the total expenditures incurred on the social services in 2008-09 ?

Exam Year(s)

UGC NET - 2012,

Answer: D

Each item in the table is given as a percentage of total government expenditure. The largest item, education, sports and youth affairs, is 4.04 in 2008-09, and every other item is smaller. So all nine items in the table are below 5 percent of total expenditure in 2008-09, which makes the answer 'all the above'. The choices of one, three or five activities each count only some items and ignore the others that also lie below 5.

Please log in or register to report this question.

4.

In which year, the expenditures on the social services have increased at the highest rate ?

Exam Year(s)

UGC NET - 2012,

Answer: B

Compare the total expenditure on social services from year to year: 11.06, 12.94, 13.06 and 14.02.

\[ 2008\text{-}09:\ 12.94-11.06=1.88 \]

\[ 2009\text{-}10:\ 13.06-12.94=0.12 \]

\[ 2010\text{-}11:\ 14.02-13.06=0.96 \]

The biggest rise, 1.88 points or about 17 percent, is in 2008-09. The answer is 2008-09. In percentage terms the rise in 2008-09 is about 17 percent, against about 1 percent in 2009-10 and about 7 percent in 2010-11.

Please log in or register to report this question.

5.

Which of the following activities remains almost stagnant in terms of share of expenditures ?

Exam Year(s)

UGC NET - 2012,

Answer: C

An item is stagnant if its share hardly changes. Information and broadcasting stays at 0.22, 0.22, 0.20 and 0.22 over the four years. North-eastern areas jumps from 0.00 to 1.56, welfare to SC/ST and OBC rises from 0.36 to 0.63, and social welfare and nutrition changes from 0.82 to 1.06. The answer is information and broadcasting. The share of information and broadcasting varies only between 0.20 and 0.22 over the four years, a spread of 0.02, while the others change by much more.

Please log in or register to report this question.

6.

Which of the following item's expenditure share is almost equal to the remaining three items in the given years ?

Exam Year(s)

UGC NET - 2012,

Answer: D

Add the three small items, information and broadcasting, welfare to SC/ST and OBC, and labour and employment, for each year and compare with social welfare and nutrition.

\[ 2007\text{-}08:\ 0.22+0.36+0.27=0.85\ (0.82) \]

\[ 2008\text{-}09:\ 0.22+0.35+0.27=0.84\ (0.72) \]

\[ 2009\text{-}10:\ 0.20+0.41+0.22=0.83\ (0.79) \]

\[ 2010\text{-}11:\ 0.22+0.63+0.25=1.10\ (1.06) \]

Social welfare and nutrition is within about 0.1 of the sum of the three in every year, so it is the item almost equal to the remaining three. The answer is social welfare and nutrition.

Please log in or register to report this question.

7.

Which of the following items of social services has registered the highest rate of increase in expenditures during 2007-08 to 2010-11 ?

Exam Year(s)

UGC NET - 2012,

Answer: B

Calculate the percentage rise in each item's share from 2007-08 to 2010-11.

\[ \text{Education: } \frac{4.46-4.02}{4.02}\approx 11\% \]

\[ \text{SC/ST and OBC: } \frac{0.63-0.36}{0.36}=75\% \]

\[ \text{Social welfare: } \frac{1.06-0.82}{0.82}\approx 29\% \]

\[ \text{Overall: } \frac{14.02-11.06}{11.06}\approx 27\% \]

Welfare to SC/ST and OBC has the highest rate, 75 percent. The answer is welfare to SC/ST and OBC.

Please log in or register to report this question.

8.

Which of the following items has registered the highest rate of decline in terms of expenditure during 2007-08 to 2009-10 ?

Exam Year(s)

UGC NET - 2012,

Answer: A

Compare each item's share in 2007-08 and 2009-10.

\[ \text{Labour: } \frac{0.22-0.27}{0.27}\approx -18.5\% \]

\[ \text{Health: } \frac{1.90-2.05}{2.05}\approx -7.3\% \]

\[ \text{Social welfare: } \frac{0.79-0.82}{0.82}\approx -3.7\% \]

\[ \text{Education: } \frac{3.96-4.02}{4.02}\approx -1.5\% \]

Labour and employment has the highest rate of decline. The answer is labour and employment.

Please log in or register to report this question.

Direction for [ Question No: 9 To 10 ] :

The following questions are based on the following information :

Number of working days annually :

YearEmployee
ABCDE
2018280310315315320
2019300290310315325
2020310300315310320
2021315310315310330
2022295300300305310

9.

Which employee has maximum working days during the years 2018-2022 ?

Exam Year(s)

MH SET - 2025, SET Exam - 2025,

Answer: D

The employee with the most working days is E.

Add each column over the five years:

  • A: 280 + 300 + 310 + 315 + 295 = 1500
  • B: 310 + 290 + 300 + 310 + 300 = 1510
  • C: 315 + 310 + 315 + 315 + 300 = 1555
  • D: 315 + 315 + 310 + 310 + 305 = 1555
  • E: 320 + 325 + 320 + 330 + 310 = 1605

E has the highest total, 1605. E also has the highest figure in every single year, which confirms the result without the full addition.

Please log in or register to report this question.

10.

Which employees have equal number of total working days during 2018-2022 ?

Exam Year(s)

MH SET - 2025, SET Exam - 2025,

Answer: B

The employees with equal totals are C and D.

The five-year totals are A 1500, B 1510, C 1555, D 1555 and E 1605. Only C and D are equal, at 1555 each.

A and B differ by 10 (1500 against 1510), B and D by 45, and A, B and C are all different. So every option other than 'C and D' names employees whose totals do not match.

Please log in or register to report this question.

Loading…
Tags: Interpretation of Data Questions and Answers