
Machine-translated by Google. Questions are authored in English.
Top

Data Interpretation Questions and Answers

Important Instructions
131.

Consider the percentage of students of different schools involved in various activities.

School→
Activities↓
SSBSCSDS
Games25302023
Music15252520
Academic30202515
Dance25152230

The difference in average number of students in various activities of CS and the average number of students in dance is ________.

Exam Year(s)

DSSSB PGT - 2023,

Answer: A

The difference is 0. For CS, the average over the four activities is (20 + 25 + 25 + 22) / 4 = 92 / 4 = 23. For dance, the average over the four schools is (25 + 15 + 22 + 30) / 4 = 92 / 4 = 23. The difference is 23 - 23 = 0.

2, 3 and 5 would result only from misreading a cell in the table.

Please log in or register to report this question.
132.

The pie chart presents the percentage contribution of different macronutrients to a typical 2,000 kcal diet of a person.

Macronutrient energy contribution (pie chart): Carbohydrates 35%, Proteins 20%, Unsaturated fat 20%, Saturated fat 20%, Trans fat 5%.

The typical energy density (kcal/g) of these macronutrients is given in the table.

MacronutrientEnergy density (kcal/g)
Carbohydrates4
Proteins4
Unsaturated fat9
Saturated fat9
Trans fat9

The total fat (all three types), in grams, this person consumes is

Exam Year(s)

GATE CS - 2024, GATE AE - 2024, GATE AG - 2024,

Answer: C

The person eats 100 g of fat.

The three fats together supply 20% + 20% + 5% = 45% of the 2,000 kcal, and every fat gives 9 kcal per gram:

\[ \begin{aligned} \text{Fat energy} &= 0.45 \times 2000 = 900\ \text{kcal} \\ \text{Fat mass} &= 900 / 9 = 100\ \text{g} \end{aligned} \]

44.4 g is the saturated (or unsaturated) fat alone, \(400/9\). 77.8 g is \(700/9\), which uses the 35% carbohydrate share by mistake. 3,600 multiplies the fat energy by 4 instead of dividing by 9.

Please log in or register to report this question.
133.

A 4 × 4 digital image has pixel intensities (\(U\)) as shown in the figure. The number of pixels with \(U \le 4\) is:

0102
4733
5544
6732

Exam Year(s)

GATE Chemistry - 2025, GATE AE - 2025,

Answer: C

There are 11 pixels with \(U \le 4\).

Count row by row the entries that are 4 or less:

  • Row 1 (0, 1, 0, 2): all 4
  • Row 2 (4, 7, 3, 3): 4, 3, 3, that is 3
  • Row 3 (5, 5, 4, 4): the two 4s, that is 2
  • Row 4 (6, 7, 3, 2): 3 and 2, that is 2

The total is 4 + 3 + 2 + 2 = 11. Counting only values strictly below 4 drops the three 4s and gives 8, which is the trap in option B. 9 and 3 miss further entries.

Please log in or register to report this question.

134.

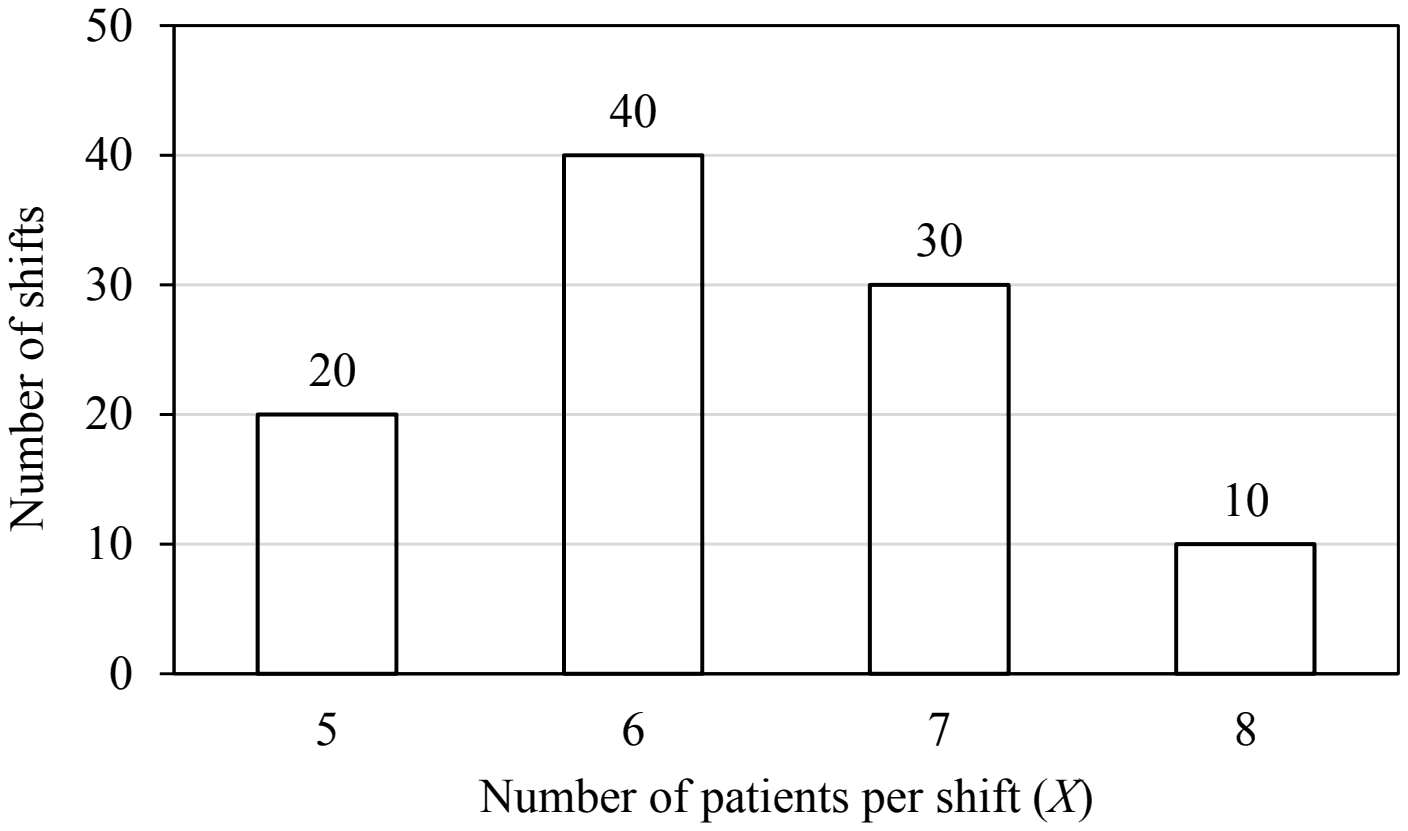
The number of patients per shift (\(X\)) consulting Dr. Gita in her past 100 shifts is shown in the figure. If the amount she earns is ₹ 1000(\(X - 0.2\)), what is the average amount (in ₹) she has earned per shift in the past 100 shifts?

Note: The figure shown is representative.

Bar chart of number of shifts against number of patients per shift X: 20 shifts at X=5, 40 shifts at X=6, 30 shifts at X=7, 10 shifts at X=8

Exam Year(s)

GATE AE - 2025,

Answer: A

She earned ₹ 6,100 per shift on average.

The mean number of patients per shift, weighted by the number of shifts, is

\[ \begin{aligned} \bar{X} &= \frac{5(20) + 6(40) + 7(30) + 8(10)}{100} \\ &= \frac{100 + 240 + 210 + 80}{100} = 6.3 \end{aligned} \]

The earning is linear in X, so the average earning is \(1000(\bar{X} - 0.2) = 1000(6.1) = 6100\) rupees. 6,300 is the mean number of patients times 1000, forgetting to subtract the 0.2 per shift. Because the earning rule is linear, averaging X first and averaging the earnings shift by shift give the same 6,100.

Please log in or register to report this question.

135.

Two finance companies, P and Q, declared fixed annual rates of interest on the amounts invested with them. The rates of interest offered by these companies may differ from year to year. Year-wise annual rates of interest offered by these companies are shown by the line graph provided below.

YearPQ
200076.5
200198
200289.5
2003108
20047.59
20056.58
200664

If the amounts invested in the companies, P and Q, in 2006 are in the ratio 8:9, then the amounts received after one year as interests from companies P and Q would be in the ratio:

Exam Year(s)

GATE AG - 2016,

Answer: D

The interest is in the ratio 4:3.

In 2006 the graph gives P's rate as 6% and Q's as 4%. Interest is amount times rate, so with amounts in the ratio 8:9:

\[ \begin{aligned} \frac{I_{P}}{I_{Q}} &= \frac{8 \times 6}{9 \times 4} \\ &= \frac{48}{36} = \frac{4}{3} \end{aligned} \]

P earns more despite the smaller deposit because its rate is one and a half times Q's. The ratios 2:3, 3:4 and 6:7 all put Q ahead, which would need Q's rate to be the higher one, as it was in 2002, 2004 and 2005 but not in 2006.

Please log in or register to report this question.

136.

A shaving set company sells 4 different types of razors, Elegance, Smooth, Soft and Executive. Elegance sells at Rs. 48, Smooth at Rs. 63, Soft at Rs. 78 and Executive at Rs. 173 per piece. The table below shows the numbers of each razor sold in each quarter of a year.

Quarter \ ProductEleganceSmoothSoftExecutive
Q12730020009176029999
Q22522219392184458942
Q328976224291954410234
Q421012182291659510109

Which product contributes the greatest fraction to the revenue of the company in that year?

Exam Year(s)

GATE CS - 2016,

Answer: B

The largest revenue share comes from Executive.

Add the four quarters for each razor and multiply by its price:

\[ \begin{aligned} \text{Elegance} &= 102510 \times 48 = 4920480 \\ \text{Smooth} &= 80059 \times 63 = 5043717 \\ \text{Soft} &= 72186 \times 78 = 5630508 \\ \text{Executive} &= 39284 \times 173 = 6796132 \end{aligned} \]

Executive sells the fewest pieces but its price is more than twice that of any other razor, so it earns the most. Elegance sells the most pieces, which is the trap, but at the lowest price it earns the least.

Please log in or register to report this question.

137.

The pie charts depict the shares of various power generation technologies in the total electricity generation of a country for the years 2007 and 2023.

Year 2007Year 2023
Coal35%20%
Gas25%15%
Wind5%10%
Hydro30%35%
Solar5%20%

The renewable sources of electricity generation consist of Hydro, Solar and Wind. Assuming that the total electricity generated remains the same from 2007 to 2023, what is the percentage increase in the share of the renewable sources of electricity generation over this period?

Exam Year(s)

GATE Life Sciences - 2024, GATE CS - 2024, GATE XE - 2024,

Answer: D

The share of renewables rose by 62.5%.

Add the Hydro, Solar and Wind shares for each year:

\[ \begin{aligned} 2007: &\ 30 + 5 + 5 = 40\% \\ 2023: &\ 35 + 20 + 10 = 65\% \\ \text{increase} &= \frac{65 - 40}{40} \times 100 = 62.5\% \end{aligned} \]

Since the total generation is unchanged, the rise in share is also the rise in renewable output.

25% is the increase in percentage points (65 - 40), not the percentage increase. 50% and 77.5% do not follow from the shares in the two charts.

Please log in or register to report this question.

138.

The data given in the following table summarizes the monthly budget of an average household.

CategoryAmount (Rs.)
Food4000
Clothing1200
Rent2000
Savings1500
Other expenses1800

The approximate percentage of the monthly budget NOT spent on savings is

Exam Year(s)

GATE Chemistry - 2012, GATE Mathematics - 2012, GATE Life Sciences - 2012, GATE XE - 2012,

Answer: D

About 86% of the budget is not spent on savings.

First total the budget, then take the savings share away from 100%:

\[ \begin{aligned} \text{Total} &= 4000 + 1200 + 2000 + 1500 + 1800 \\ &= 10500 \\ \text{Savings} &= \frac{1500}{10500} \times 100 \approx 14.3\% \\ \text{Not savings} &\approx 100 - 14.3 = 85.7\% \end{aligned} \]

14% is the share that is saved, the trap answer for anyone who misses the NOT. 10% and 81% match no ratio of the table's figures.

Please log in or register to report this question.

139.

40% of deaths on city roads may be attributed to drunken driving. The number of degrees needed to represent this as a slice of a pie chart is

Exam Year(s)

GATE Chemistry - 2017,

Answer: B

The slice needs 144 degrees.

A full pie chart is 360°, and each slice is the same fraction of 360° as its share of the total:

\[ 0.40 \times 360^{\circ} = 144^{\circ} \]

120° is a third of the circle (about 33%), and 160° is about 44%. 212° is close to the 60% remainder (216°), the slice for deaths not attributed to drunken driving, not the 40% asked for.

Please log in or register to report this question.

140.

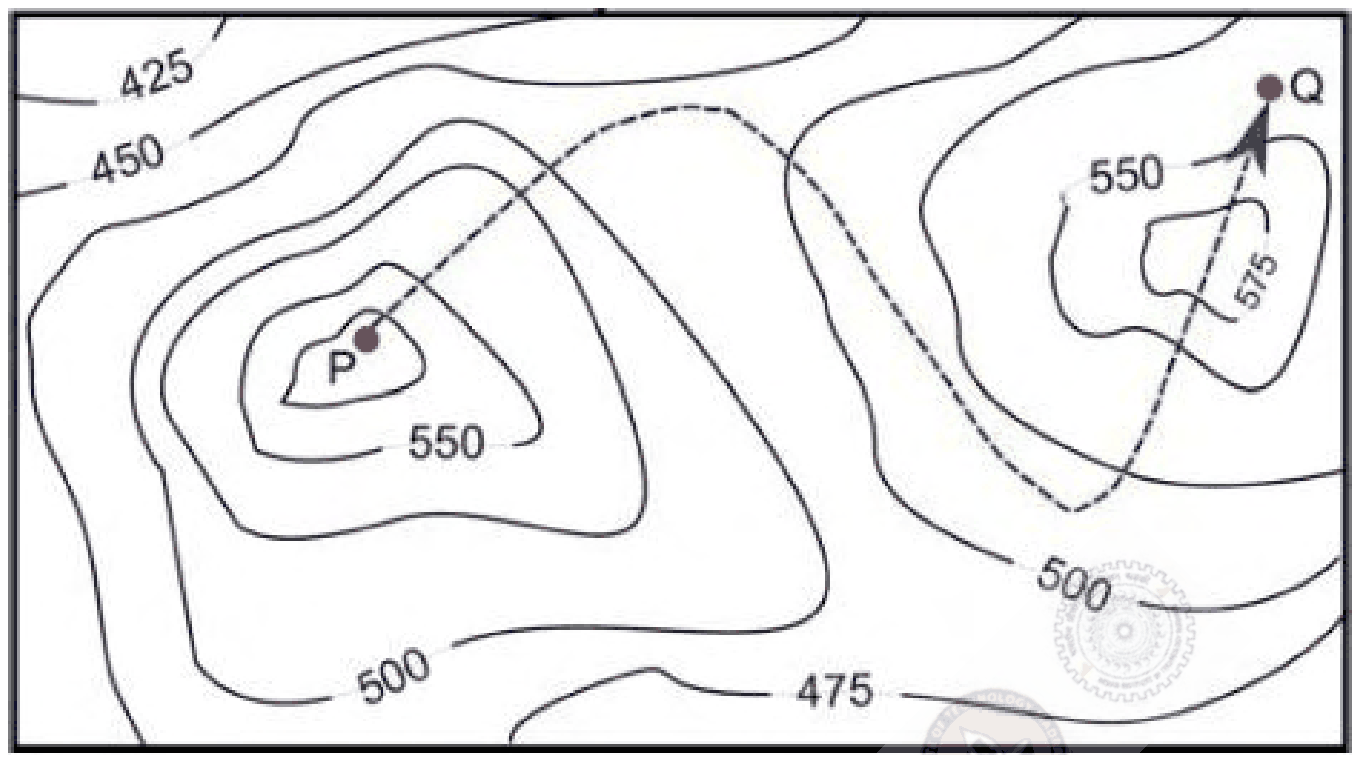
A contour line joins locations having the same height above the mean sea level. The following is a contour plot of a geographical region. Contour lines are shown at 25 m intervals in this plot.

Contour map with two hills; a dashed path runs from P near the top of the left hill, through the low ground between them, across the top of the right hill to Q

The path from P to Q is best described by

Exam Year(s)

GATE Chemistry - 2017,

Answer: C

The path is best described as Down-Up-Down.

Read the heights from the contours, which are 25 m apart. P lies inside the innermost contour of the left-hand hill, above 550 m, so the path starts near a summit and first goes down, crossing the hill's contours outward into the lower ground between the two hills. It then climbs the right-hand hill, crossing its contours inward past 550 m and through the small 575 m closed contour at the top: up. Q lies outside that 575 m loop but inside the 550 m contour, so the last stretch drops a little from the top: down.

Options beginning 'Up' are wrong because P is already at a peak. 'Down-Up-Down-Up' adds a final climb that the path does not make, since Q is lower than the summit the path crosses.

Please log in or register to report this question.

Loading…

Other Subjects

Tags: Data Interpretation Questions and Answers || DI MCQ Questions || Data Analysis Quantitative Aptitude || Data Interpretation GK Questions || DI on Quantitative Aptitude