
Machine-translated by Google. Questions are authored in English.
Top

Data Interpretation Questions and Answers

Important Instructions
Direction for [ Question No: 11 To 11 ] :

Directions : Refer to the following pie charts and solve the questions based on it.

(Two pie charts, given here as one table.)

RegionPercentage wise distribution of population of wild animalsPercentage wise distribution of land under forest cover
A119%15%
A213%14%
A320%22%
A411%8%
A514%14%
A615%18%
A78%9%

Following are the geographical regions : A1 - Asia, China, India, A2 - Australia, A3 - Africa, A4 - Europe, A5 - Russia, A6 - North & South America, A7 - Antarctica.

Population density = (Percentage Population of Animals) / (Percentage Land Area Under Forest Cover)

11.

If in the next 10 years, the population of wild animals in Antarctica will increase by 2·5% more than that in the rest of the world, what will be the percentage population of wild animals in Antarctica after 10 years ?

Exam Year(s)

Punjab Civil Service - 2021,

Answer: D

The answer is Cannot be determined.

Antarctica now has 8% of the wild animals. The question says its population will grow 2·5% more than that of the rest of the world, but it never says how fast the rest of the world grows.

Antarctica's future share depends on both growth rates. If the rest of the world stayed level, Antarctica's 8 units would grow to 8.2 and its share to about 8.2%; with other growth rates the share changes again. None of 9·5%, 10·5% or 15·7% can be fixed without the missing rate.

Please log in or register to report this question.
Direction for [ Question No: 12 To 13 ] :

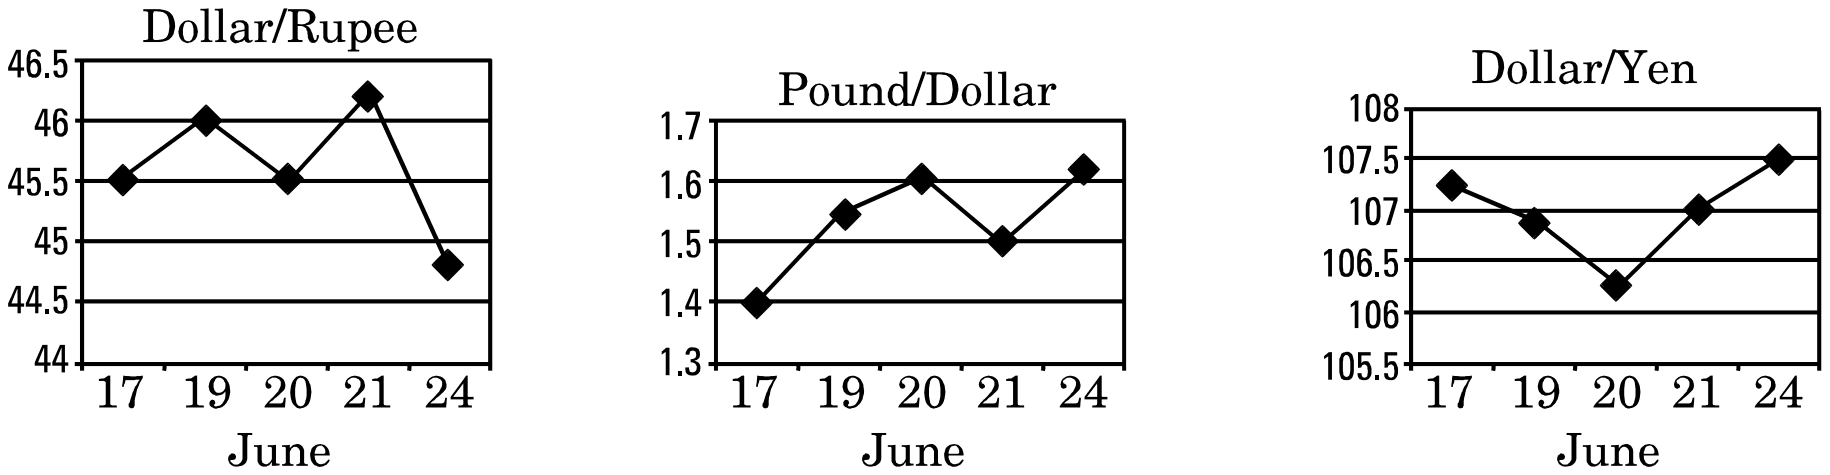
Directions : Refer to the following line charts and solve the questions based on it.

12.

If the Dollar/Yen ratio follows the same trend from 24th to 27th as from 21st to 24th, then what will be the value of $ 50 on 27th June ?

Three line charts for 17, 19, 20, 21 and 24 June. Dollar/Rupee: 45.5, 46, 45.5, about 46.2, about 44.8. Pound/Dollar: 1.4, about 1.55, 1.6, 1.5, about 1.62. Dollar/Yen: about 107.2, about 106.9, about 106.3, 107, 107.5.

Exam Year(s)

Punjab Civil Service - 2021,

Answer: B

On 27th June, 50 dollars would be worth 5,400 Yen.

The Dollar/Yen chart reads 107 on the 21st and 107.5 on the 24th, a rise of 0.5 over those three days. The same trend from the 24th to the 27th takes it to 108.

\[ 50 \times 108 = 5400 \text{ Yen} \]

The question asks about the Dollar/Yen ratio, so the two rupee options are beside the point, and at Dollar/Rupee rates near 45 they would not equal 50 dollars in any case. 6,000 Yen would need a rate of 120, far above the chart.

Please log in or register to report this question.

13.

A jacket costs $ 400. Mohan has ₹ 18,200, 225 Pounds and 35,000 Yen with him. If he can use only one currency to buy the jacket, he would be able to buy the jacket on 20th June using :

The same three line charts, Dollar/Rupee, Pound/Dollar and Dollar/Yen, for 17 to 24 June. On 20 June they read 45.5, 1.6 and about 106.3.

Exam Year(s)

Punjab Civil Service - 2021,

Answer: A

On 20th June Mohan could buy the jacket only with 18,200 Rupees.

Read each chart on 20th June and convert the 400-dollar price:

\[ \begin{aligned} \text{Rupees} &: 400 \times 45.5 = 18200 \\ \text{Pounds} &: 400 / 1.6 = 250 \\ \text{Yen} &: 400 \times 106.3 \approx 42500 \end{aligned} \]

His ₹ 18,200 exactly meets the rupee price. His 225 Pounds fall short of 250, and 35,000 Yen is far below about 42,500, so neither of those currencies works. Since the answer can be read from the charts, 'Cannot be determined' is wrong.

Please log in or register to report this question.

Direction for [ Question No: 14 To 16 ] :

Directions : The following table gives the career record in One-Day International Cricket of few batsmen.

NameMatches PlayedInnings PlayedRuns ScoredAverage
P15048180040·0
P25050203445·2
P34646167936·5
P44444153940·5
P54038180651·6
P64240144542·5

The average is calculated by dividing the total runs scored by the total number of matches in which the batsman got out.

14.

Who among the following did not get out for the maximum number of times ?

Exam Year(s)

Punjab Civil Service - 2021,

Answer: D

Among the options, P6 remained not out the most times.

Since average = runs / times out, the number of times each batsman got out is runs divided by average:

BatsmanInningsTimes outNot out
P1481800 / 40 = 453
P2502034 / 45.2 = 455
P3461679 / 36.5 = 460
P4441539 / 40.5 = 386
P5381806 / 51.6 = 353
P6401445 / 42.5 = 346

P6 was not out in 6 innings, more than P1 (3), P2 (5) or P5 (3). P4 also has 6 not-outs but is not among the options.

Choosing P5 because of the highest average, or P2 because of the most runs, confuses scoring with not-outs.

Please log in or register to report this question.

15.

If the average is calculated on the basis of the total innings played, whose average will see the minimum change ?

Exam Year(s)

Punjab Civil Service - 2021,

Answer: B

P3's average would change the least.

Since average = runs / times out, the number of times each batsman got out is runs divided by average:

BatsmanInningsTimes outNot out
P1481800 / 40 = 453
P2502034 / 45.2 = 455
P3461679 / 36.5 = 460
P4441539 / 40.5 = 386
P5381806 / 51.6 = 353
P6401445 / 42.5 = 346

P3 got out in all 46 innings, so dividing his runs by innings gives the same 36·5: no change at all. The others fall: P1 to 1800 / 48 = 37.5, P5 to 1806 / 38 = 47.5 and P6 to 1445 / 40 = 36.1.

The batsman with more not-outs sees the bigger change, which is why P6 changes the most among the options.

Please log in or register to report this question.

16.

How many of the batsmen got out in all the innings played ?

Exam Year(s)

Punjab Civil Service - 2021,

Answer: B

Only 1 batsman got out in every innings he played.

Since average = runs / times out, the number of times each batsman got out is runs divided by average:

BatsmanInningsTimes outNot out
P1481800 / 40 = 453
P2502034 / 45.2 = 455
P3461679 / 36.5 = 460
P4441539 / 40.5 = 386
P5381806 / 51.6 = 353
P6401445 / 42.5 = 346

Only P3 has as many dismissals as innings (46 of 46). Every other batsman has at least 3 not-outs.

'Cannot be determined' is wrong, because the definition of the average lets you recover the number of dismissals exactly; 0 and 2 miscount P3.

Please log in or register to report this question.

Direction for [ Question No: 17 To 18 ] :

Directions : Read the following information and solve the questions based on it.

Shakuntala, an intelligent baby girl, plucks apples from her father’s orchard on ten consecutive days. When asked by her mother as to how many apples has she plucked from the orchard daily, she gives the following sheet to her mother :

Figure 1 (bar chart): Sum of the apples for the given three days

Three days taken at a timeSum
1+2+3130
2+3+4150
3+4+5165
4+5+6145
5+6+7140
6+7+8160
7+8+9175
8+9+10155

Figure 2 (bar chart): Sum of apples on given five days

Five days taken at a timeSum
1+2+3+4+5240
2+3+4+5+6225
3+4+5+6+7265
4+5+6+7+8270
5+6+7+8+9250
6+7+8+9+10255

17.

What is the number of apples plucked on day 6 ?

Exam Year(s)

Punjab Civil Service - 2021,

Answer: B

On day 6 Shakuntala plucked 35 apples.

Combine a five-day sum with a three-day sum that starts on the same day:

\[ \begin{aligned} d_7 + d_8 &= (d_4 + \dots + d_8) - (d_4 + d_5 + d_6) \\ &= 270 - 145 = 125 \\ d_6 &= (d_6 + d_7 + d_8) - 125 \\ &= 160 - 125 = 35 \end{aligned} \]

The charts are therefore enough, so 'Cannot be determined' is wrong. 45 and 25 are the counts for other days (day 10 and day 2) when every day is worked out the same way.

Please log in or register to report this question.

18.

For how many days, is it possible to determine the exact number of apples plucked by Shakuntala ?

Exam Year(s)

Punjab Civil Service - 2021,

Answer: D

The charts fix the apples of all ten days, so none of the options 0, 5 or 3 is right and the answer is None of the above.

Let the days be d1 to d10. The first question found d6 = 35 from d4 + d5 + d6 = 145 and the two sums that give d7 + d8 = 125. The rest follows step by step:

\[ \begin{aligned} d_4 + d_5 &= 145 - 35 = 110 \\ d_3 &= 165 - 110 = 55 \\ d_3 + \dots + d_7 = 265 &\Rightarrow d_7 = 265 - 55 - 110 - 35 = 65 \\ d_5 &= 140 - 35 - 65 = 40, \quad d_4 = 70 \\ d_8 &= 125 - 65 = 60 \\ d_9 &= 175 - 65 - 60 = 50 \\ d_{10} &= 155 - 60 - 50 = 45 \\ d_2 &= 150 - 55 - 70 = 25, \quad d_1 = 130 - 25 - 55 = 50 \end{aligned} \]

So the ten days are 50, 25, 55, 70, 40, 35, 65, 60, 50 and 45, and every one of the eight three-day sums and six five-day sums in the charts is reproduced by them. Solving all fourteen equations leaves no free unknown, so the exact count is determined for all 10 days. Zero, 5 and 3 are all too few.

Please log in or register to report this question.

Direction for [ Question No: 19 To 19 ] :

Directions : Based on the information given below in diagram for Flight booking price scheme :

19.

A party of three book to fly on the afternoon flight to destination C and opt for total two items of hold luggage and the environment offset. How much is the cost of their trip ?

Flight booking scheme. Fares: A 08.00 Rs. 22500, A 17.00 Rs. 7500, B 06.00 Rs. 14200, B 21.00 Rs. 9800, C 11.00 Rs. 6300, C 22.00 Rs. 7200, D 08.00 Rs. 8000, D 16.00 Rs. 10400. Extras per passenger per flight: luggage Rs. 2000 per item, insurance Rs. 900, environmental offset Rs. 350.

Exam Year(s)

Punjab Civil Service - 2021,

Answer: A

The trip costs ₹ 26,650.

Destination C has two flights, at 11.00 for Rs. 6,300 and at 22.00 for Rs. 7,200. The 11.00 flight is the morning one, so the paper's afternoon flight is the later one at Rs. 7,200 per passenger. The extras are Rs. 2,000 per item of hold luggage and Rs. 350 per passenger for the environmental offset.

\[ \begin{aligned} \text{fares} &= 3 \times 7200 = 21600 \\ \text{luggage} &= 2 \times 2000 = 4000 \\ \text{offset} &= 3 \times 350 = 1050 \\ \text{total} &= 26650 \end{aligned} \]

Leaving out the offset gives 25,600; charging the offset for only two people gives 26,300; and charging luggage for three items gives 27,600. Using the 11.00 fare instead gives 23,950, which is not offered.

Please log in or register to report this question.

Direction for [ Question No: 20 To 20 ] :

Directions : Answer the following questions based on the information and diagram given below :

An automobile company has advertised for the appointment of trainee engineers in different disciplines. First the applications received are thoroughly scrutinized and good ones are called to the main centre of the company for two written tests and a viva. The written tests are of 2 hrs duration each.

The first written test E1 checks the general scientific background and the second written test E2 checks the basics of the discipline. Earlier all the candidates were required to appear in both E1 and E2 but only those who clear both were allowed to appear in the viva for final selection.

To minimize the cost, the company has decided to change the procedure. Now they want to conduct this exam in three stages.

In the first stage they may offer the candidate to sit in either written test (E1 or E2) and if s/he passes in that he/she will go for next stage in which company may take his/her other written test or viva. If he passes in this second stage, he will go for the remaining exam in third stage.

A candidate has to pass both the exams and viva for final selection. A candidate is rejected if s/he fails at any stage. The expenses are ₹ 500 per candidate for conducting each of E1, E2 or Viva (V). The following historical data for 100 candidates is available from previous selections.

20.

What is the ratio of the “percentage of candidates clearing E2 exam in second stage after clearing E1 exam in first stage” to “percentage of candidates clearing E1 exam in second stage after clearing E2 exam in first stage” ?

Three Venn diagrams. First stage, 100 candidates: cleared E1 but failed E2 30, both 40, cleared E2 but failed E1 20. The 70 who cleared E1: E2 but not viva 10, both 30, viva but not E2 20. The 60 who cleared E2: E1 but not viva 10, both 30, viva but not E1 15.

Exam Year(s)

Punjab Civil Service - 2021,

Answer: A

The ratio is \(\frac{4}{7} : \frac{2}{3}\).

Read the two second-stage diagrams.

  • Of the 70 candidates who cleared E1 first, those who cleared E2 in the second stage are 10 + 30 = 40, a fraction of 40/70 = 4/7.
  • Of the 60 who cleared E2 first, those who cleared E1 in the second stage are 10 + 30 = 40, a fraction of 40/60 = 2/3.

The two percentages are therefore in the ratio 4/7 : 2/3.

The options beginning with 3/7 count only the 30 candidates who cleared both E2 and the viva, leaving out the 10 who cleared E2 but failed the viva. None of 3/7, 2/7 or 1/5 matches the 40 out of 60 in the other diagram.

Please log in or register to report this question.

Loading…

Other Subjects

Tags: Data Interpretation Questions and Answers || DI MCQ Questions || Data Analysis Quantitative Aptitude || Data Interpretation GK Questions || DI on Quantitative Aptitude