
Machine-translated by Google. Questions are authored in English.
Top

Data Interpretation Questions and Answers

Important Instructions
141.

In an election, the share of valid votes received by the four candidates A, B, C, and D is represented by the pie chart shown. The total number of votes cast in the election were 1,15,000, out of which 5,000 were invalid.

Share of valid votes
A40%
B25%
C20%
D15%

Based on the data provided, the total number of valid votes received by the candidates B and C is

Exam Year(s)

GATE Chemistry - 2024,

Answer: B

B and C together received 49,500 valid votes.

Valid votes = 1,15,000 - 5,000 = 1,10,000. B and C together hold 25% + 20% = 45% of the valid votes:

\[ 0.45 \times 110000 = 49500 \]

Taking 45% of all votes cast, including the invalid ones, gives 51,750, the main trap. 45,000 and 54,000 do not come from either total.

Please log in or register to report this question.
142.

Person 1 and Person 2 invest in three mutual funds A, B, and C. The amounts they invest in each of these mutual funds are given in the table.

Mutual fund AMutual fund BMutual fund C
Person 1₹10,000₹20,000₹20,000
Person 2₹20,000₹15,000₹15,000

At the end of one year, the total amount that Person 1 gets is ₹500 more than Person 2. The annual rate of return for the mutual funds B and C is 15% each. What is the annual rate of return for the mutual fund A?

Exam Year(s)

GATE Chemistry - 2024,

Answer: B

Mutual fund A returned 10%.

Let A's rate be r. Each person's total after a year:

\[ \begin{aligned} P_{1} &= 10000(1 + r) + 40000(1.15) = 56000 + 10000r \\ P_{2} &= 20000(1 + r) + 30000(1.15) = 54500 + 20000r \\ P_{1} - P_{2} &= 1500 - 10000r = 500 \Rightarrow r = 0.10 \end{aligned} \]

Check: Person 1 gets 57,000 and Person 2 gets 56,500, a difference of 500. A rate of 15% would give a difference of zero, and 7.5% or 20% give 750 and -500.

Please log in or register to report this question.
143.

The number of patients per shift (X) consulting Dr. Gita in her past 100 shifts is shown in the figure. If the amount she earns is ₹ \(1000(X - 0.2)\), what is the average amount (in ₹) she has earned per shift in the past 100 shifts?

Note: The figure shown is representative.

Number of patients per shift (X)5678
Number of shifts20403010

Exam Year(s)

GATE Chemistry - 2025,

Answer: A

The average earning is ₹ 6,100.

First find the mean number of patients per shift from the 100 shifts:

\[ \begin{aligned} \bar{X} &= \frac{5(20) + 6(40) + 7(30) + 8(10)}{100} \\ &= \frac{100 + 240 + 210 + 80}{100} = 6.3 \end{aligned} \]

The earning is a linear function of X, so its average is the same function of the average:

\[ 1000(6.3 - 0.2) = 6100 \]

₹ 6,300 forgets to subtract 0.2, ₹ 6,000 uses the most common value 6 instead of the mean, and ₹ 6,500 does not match any consistent reading of the chart.

Please log in or register to report this question.
Answer: C

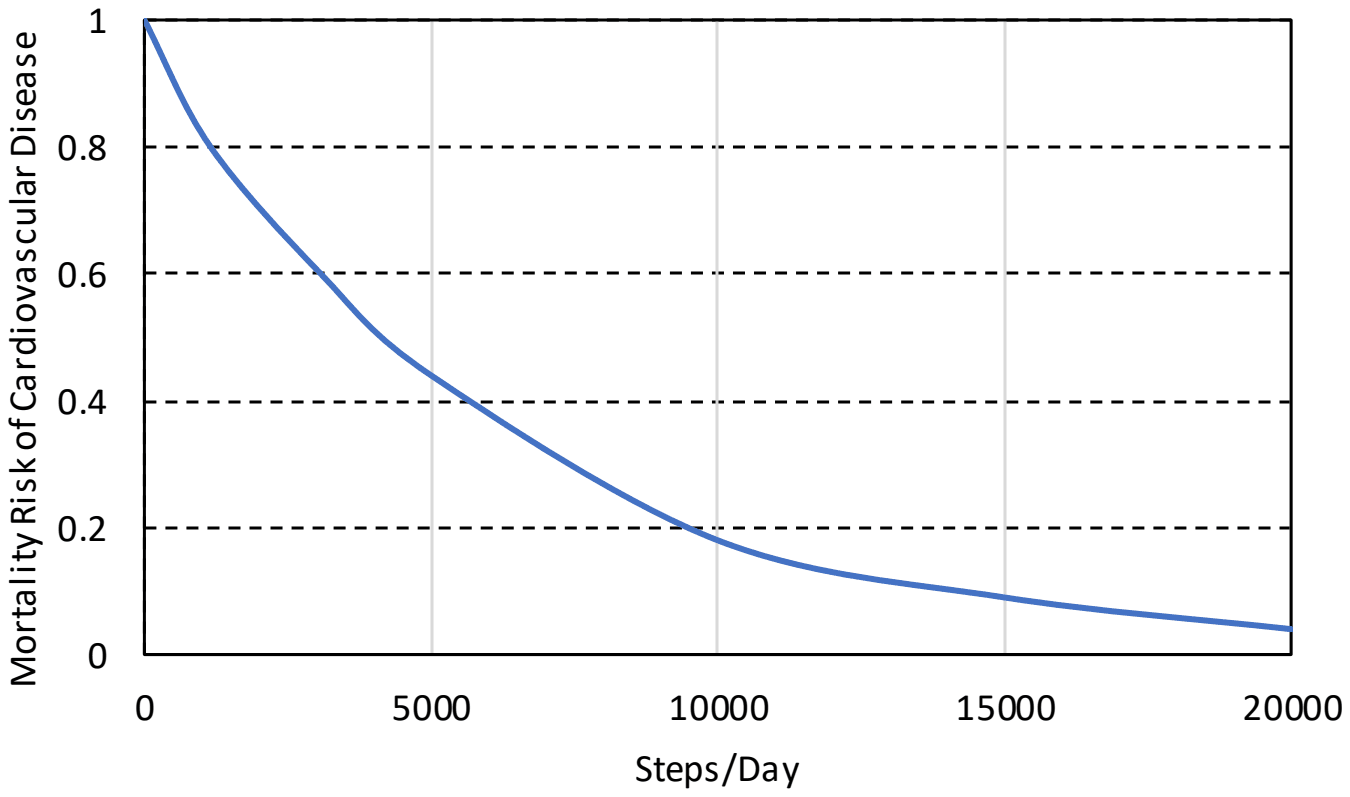
The true statement is For any 5000 increment in steps/day the largest risk reduction occurs on going from 0 to 5000.

Reading the plot, the risk falls from 1 to about 0.44 between 0 and 5000 steps, a drop of about 0.56. From 5000 to 10000 it falls by about 0.26, from 10000 to 15000 by about 0.09, and from 15000 to 20000 by about 0.05. The curve is steepest at the start and flattens out.

So the first option is false (a drop of about 0.82 from 0 to 10000 against about 0.14 from 10000 to 20000), the second is false (0.56 against 0.05), and the last picks the smallest drop instead of the largest.

Please log in or register to report this question.
145.

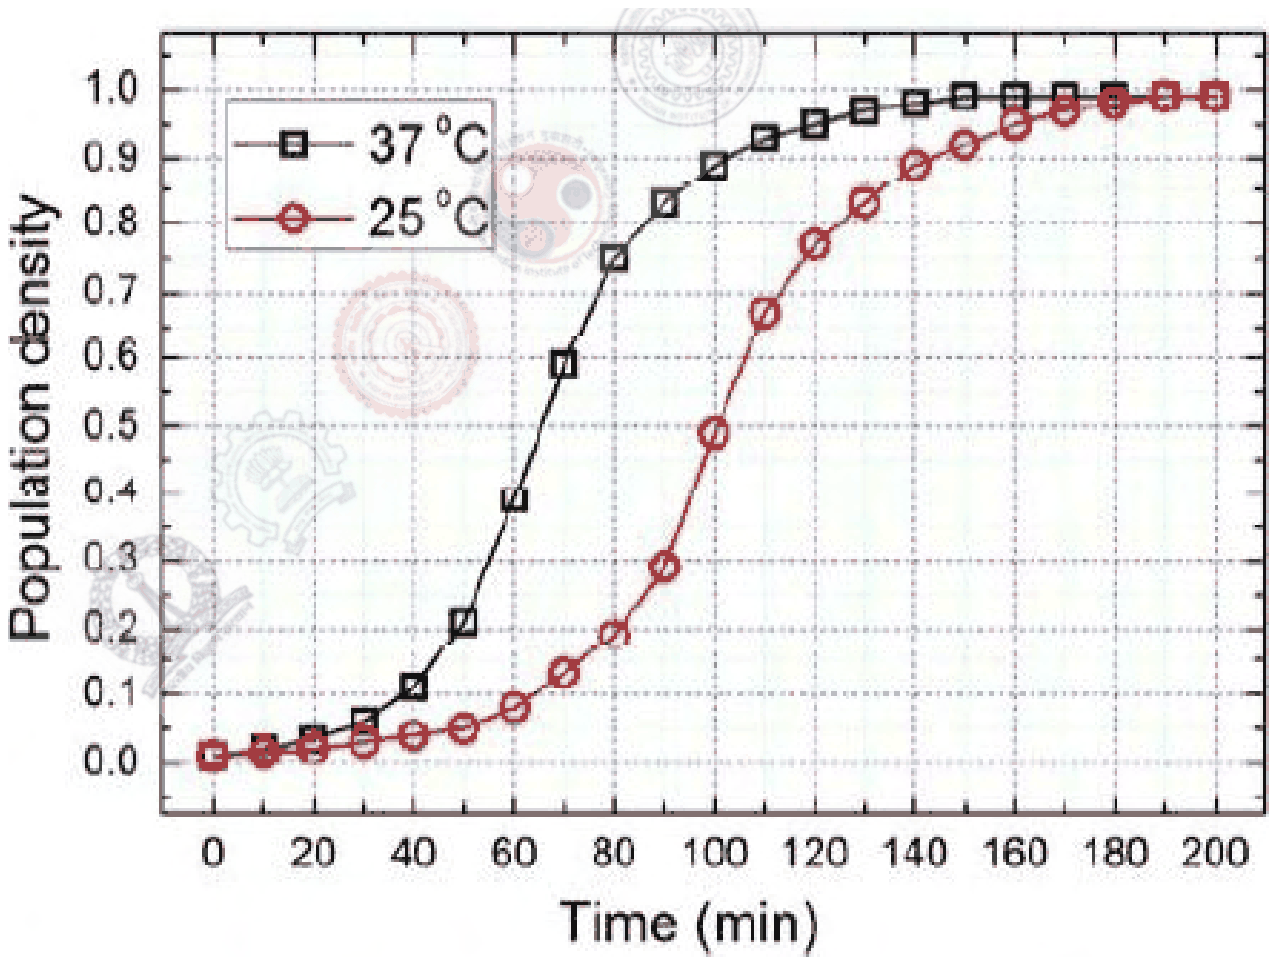
The growth of bacteria (lactobacillus) in milk leads to curd formation. A minimum bacterial population density of 0.8 (in suitable units) is needed to form curd. In the graph below, the population density of lactobacillus in 1 litre of milk is plotted as a function of time, at two different temperatures, 25 °C and 37 °C.

Population density against time from 0 to 200 min: the 37 C curve reaches 0.8 at about 85 min and levels off near 1.0 from about 150 min; the 25 C curve reaches 0.8 at about 125 min and levels off near 1.0 from about 180 min

Consider the following statements based on the data shown above:

i. The growth in bacterial population stops earlier at 37 °C as compared to 25 °C
ii. The time taken for curd formation at 25 °C is twice the time taken at 37 °C

Which one of the following options is correct?

Exam Year(s)

GATE ME - 2017,

Answer: A

The correct option is Only i.

Statement i: the 37 °C curve levels off near 1.0 by about 150 min, while the 25 °C curve keeps rising until about 180 to 190 min. So growth stops earlier at 37 °C, and statement i is true.

Statement ii: curd forms when the density reaches 0.8. The 37 °C curve crosses 0.8 at about 85 min and the 25 °C curve at about 125 min. 125 is roughly 1.5 times 85, not twice, so statement ii is false.

That rules out "Only ii" and "Both i and ii", and "Neither" ignores the earlier plateau at 37 °C.

Please log in or register to report this question.

146.

A certain country has 504 universities and 25951 colleges. These are categorised into Grades I, II, and III as shown in the given pie charts.

What is the percentage, correct to one decimal place, of higher education institutions (colleges and universities) that fall into Grade III?

Grade IGrade IIGrade III
Universities31%62%7%
Colleges9%68%23%

Exam Year(s)

GATE ME - 2023,

Answer: A

The share in Grade III is 22.7 per cent.

Grade III holds 7% of the universities and 23% of the colleges, so count the institutions in each and divide by the total of 504 + 25951 = 26455.

\[ \begin{aligned} 0.07 \times 504 &= 35.28 \\ 0.23 \times 25951 &= 5968.73 \\ 35.28 + 5968.73 &= 6004.01 \end{aligned} \]

\[ \frac{6004.01}{26455} \times 100 \approx 22.7\% \]

Because colleges outnumber universities about fifty to one, the result sits just below the college figure of 23%. Taking the plain average of 7% and 23% gives 15.0, which wrongly gives both groups equal weight; 23.7 and 66.8 do not come from the Grade III shares at all.

Please log in or register to report this question.

Answer: C

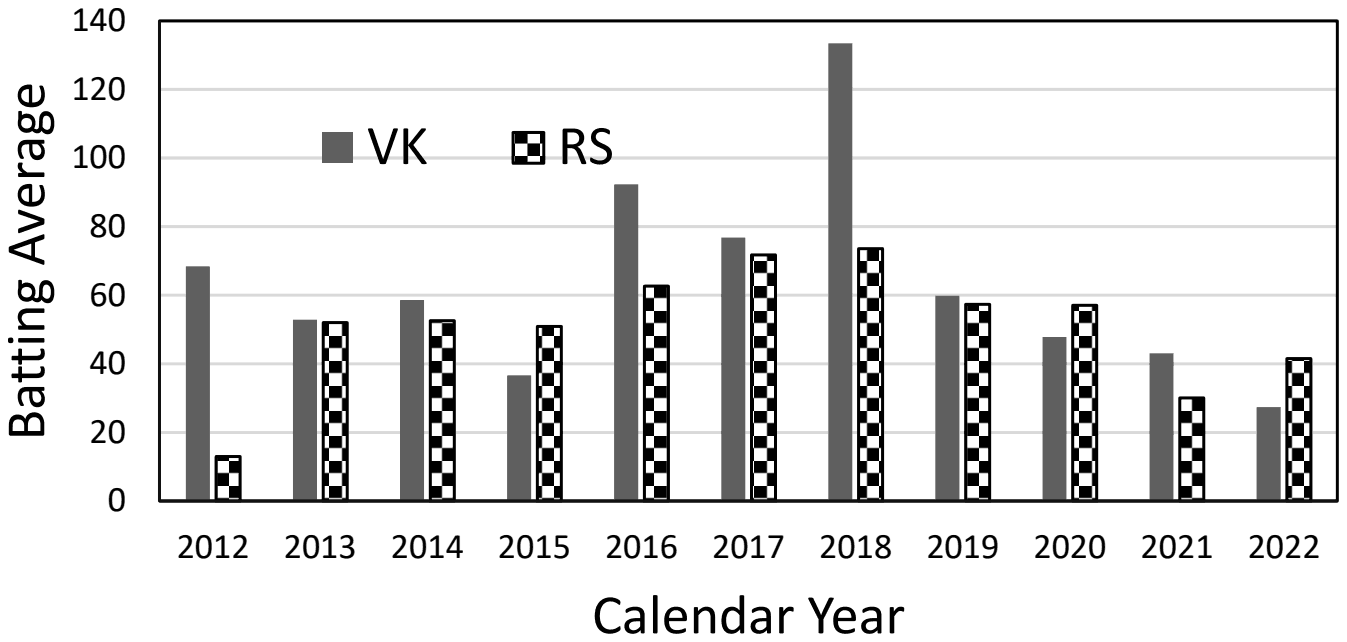
The true statement is that VK's yearly batting average is consistently higher than that of RS between the two world cup years.

Between 2015 and 2019 lie 2016, 2017 and 2018. In each, VK's bar is above RS's: about 92 against 63, 77 against 72, and 133 against 74.

The other statements fail on one year each. RS is not higher in every world cup year, because in 2019 VK (about 60) is slightly above RS (about 58). VK is not higher in every world cup year, because in 2015 RS (about 51) is well above VK (about 37). And RS is not consistently higher in the last three years, because in 2021 VK (about 43) is above RS (about 30).

Please log in or register to report this question.

Answer: C

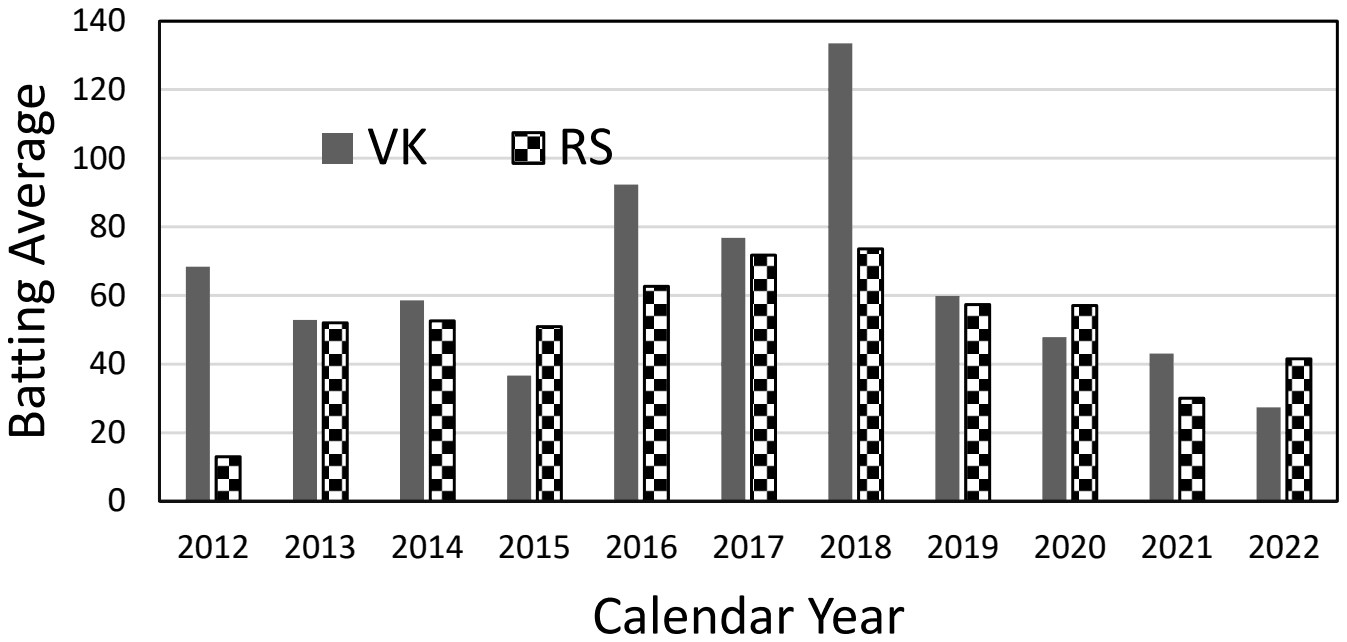
The true statement is that VK's yearly batting average is consistently higher than that of RS between the two world cup years.

Between 2015 and 2019 lie 2016, 2017 and 2018. In each, VK's bar is taller: about 92 against 62, 77 against 72, and 133 against 74.

The others fail on the chart. In 2015 RS (about 51) is above VK (about 36), so VK is not higher in every world cup year; in 2019 VK (about 60) is just above RS (about 57), so RS is not higher in every world cup year either. In the last three years RS is higher in 2020 and 2022 but VK is higher in 2021 (about 43 against 30), so RS is not consistently higher.

Please log in or register to report this question.

149.

A bag contains Violet (V), Yellow (Y), Red (R), and Green (G) balls. On counting them, the following results are obtained:

(i) The sum of Yellow balls and twice the number of Violet balls is 50.
(ii) The sum of Violet and Green balls is 50.
(iii) The sum of Yellow and Red balls is 50.
(iv) The sum of Violet and twice the number of Red balls is 50.

Which one of the following Pie charts correctly represents the balls in the bag?

Exam Year(s)

GATE Life Sciences - 2025,

Answer: A

The correct chart is V 10%, R 20%, Y 30%, G 40%.

Write the four statements as equations: \(Y + 2V = 50\), \(V + G = 50\), \(Y + R = 50\) and \(V + 2R = 50\). The first and last both equal 50, so

\[ \begin{aligned} Y + 2V &= V + 2R \Rightarrow Y + V = 2R \\ (50 - R) + V &= 2R \Rightarrow V = 3R - 50 \\ (3R - 50) + 2R &= 50 \Rightarrow R = 20 \end{aligned} \]

Then \(V = 10\), \(Y = 50 - 20 = 30\) and \(G = 50 - 10 = 40\). The total is 100 balls, so the counts are also the percentages: V 10%, R 20%, Y 30%, G 40%.

The other charts fail a statement at once. V 40% would make \(Y + 2V\) at least 80, not 50; V 30% with Y 10% gives \(10 + 60 = 70\); V 20% with Y 40% gives \(40 + 40 = 80\).

Please log in or register to report this question.

150.

Following bar chart presents supply as a percentage of demand of a product and demand as a percentage of capacity of the industry to produce the same product. All the values are multiples of 5.

YearSupply of demandDemand of capacity
20036580
20047090
20056080
20069065

If product supply for the year 2005 is 6000 kg. then the total capacity of the product is (in kg):

Exam Year(s)

HPPSC HPAS - 2021,

Answer: A

The total capacity is 12500 kg.

In 2005, supply was 60% of demand and demand was 80% of capacity. Work back from the supply.

\[ \begin{aligned} \text{demand} &= \frac{6000}{0.60} = 10000 \\ \text{capacity} &= \frac{10000}{0.80} = 12500 \end{aligned} \]

10000 is the demand, the trap for anyone who stops after the first step. 16500 does not follow from the 2005 values. In one line, capacity is supply divided by both percentages: \(6000 \div (0.6 \times 0.8) = 12500\).

Please log in or register to report this question.

Loading…
Tags: Data Interpretation Questions and Answers || DI MCQ Questions || Data Analysis Quantitative Aptitude || Data Interpretation GK Questions || DI on Quantitative Aptitude