
Machine-translated by Google. Questions are authored in English.
Top

Mechanical Properties of Materials Questions and Answers

Direction for [ Question No: 1 To 4 ] :

Useful data

Boltzmann's constant\(1.38 \times 10^{-23}\) J K-1
Charge on an electron\(1.602 \times 10^{-19}\) C
Gas Constant8.314 J mol-1 K-1
Electron rest mass\(9.1 \times 10^{-31}\) kg
Permittivity of vacuum (εo)\(8.854 \times 10^{-12}\) F m-1
Bohr Magneton\(9.274 \times 10^{-24}\) A/m2

1.

Which material has the lowest specific heat capacity at room temperature?

Exam Year(s)

GATE XE - 2012,

Answer: B

The lowest specific heat capacity belongs to Mercury.

Approximate specific heats at room temperature, per unit mass:

  • water: about 4.18 J/(g K)
  • copper: about 0.385 J/(g K)
  • silver: about 0.235 J/(g K)
  • mercury: about 0.14 J/(g K)

The molar heat capacity of metals is roughly the same (the Dulong-Petit value, about 25 J/(mol K)), so on a per-gram basis the heaviest atoms have the lowest specific heat. Mercury, with an atomic mass of about 201, comes out lowest; silver (108) and copper (64) are higher. Water, with its hydrogen bonding, has one of the highest specific heats of any common substance.

Please log in or register to report this question.
Answer: A

The Pilling-Bedworth ratio is the ratio of volume of oxide to volume of metal.

It compares the volume of the oxide formed with the volume of the metal consumed to form it:

\[ \text{PBR} = \frac{M_{ox}\,\rho_{m}}{n\,M_{m}\,\rho_{ox}} \]

where n is the number of metal atoms per oxide formula unit. A ratio below 1 (as for magnesium) gives a porous, non-protective oxide; between about 1 and 2 (as for aluminium) a dense protective film; and well above 2 an oxide that cracks and spalls.

The formula contains densities and masses, which may tempt one towards the weight or density options, but the quantity defined is a volume ratio.

Please log in or register to report this question.

3.

Match the properties in Column I with the appropriate units in Column II

Column IColumn II
P. Thermal diffusivity1. Hm-1
Q. Fracture toughness2. m2s-1
R. Surface energy3. Fm-1
S. Magnetic permeability4. Nm-3/2
5. Jm-2

Exam Year(s)

GATE XE - 2012,

Answer: B

The match is P-2, Q-4, R-5, S-1.

  • Thermal diffusivity \(\alpha = k/(\rho c_{p})\) has units m2s-1.
  • Fracture toughness \(K_{IC} = Y\sigma\sqrt{\pi a}\) is stress times root length, Pa m1/2 = N m-2 m1/2 = N m-3/2.
  • Surface energy is energy per unit area, J m-2.
  • Magnetic permeability has units H m-1, as in \(\mu_{0} = 4\pi \times 10^{-7}\) H/m.

F m-1 is the unit of electrical permittivity, a distractor for permeability. Options that give fracture toughness J m-2 confuse it with the critical strain energy release rate.

Please log in or register to report this question.

4.

Match the properties in Column I with the options in Column II

Column IColumn II
P. Toughness1. Resistance to plastic deformation
Q. Resilience2. Time dependent permanent deformation under constant load
R. Creep3. Total elongation at failure
S. Hardness4. Area under the stress-strain curve
5. Area under the elastic part of the stress-strain curve

Exam Year(s)

GATE XE - 2012,

Answer: C

The match is P-4, Q-5, R-2, S-1.

  • Toughness is the energy absorbed up to fracture, the whole area under the stress-strain curve.
  • Resilience is the energy stored elastically, the area under the elastic part of the curve.
  • Creep is time-dependent permanent deformation under constant load, usually at high temperature.
  • Hardness is resistance to plastic deformation, typically local indentation.

'Total elongation at failure' is ductility, which is not in Column I, so options that use item 3 are wrong. Swapping toughness and resilience, as two of the options do, confuses the whole curve with its elastic part.

Please log in or register to report this question.

5.

In the engineering stress-strain curve for mild steel, the Ultimate Tensile Strength (UTS) refers to

Exam Year(s)

GATE ME - 2017,

Answer: C

The UTS is the maximum stress on the engineering stress-strain curve.

Engineering stress is load divided by the original area. It rises through yielding and strain hardening to a peak, the ultimate tensile strength, where necking begins; after that the load, and so the engineering stress, falls until fracture.

The proportional limit is the end of the straight elastic line, and the yield stress is where plastic deformation starts; both are well below the UTS for mild steel. The fracture stress on the engineering curve is lower than the UTS, because the load drops during necking.

Please log in or register to report this question.

6.

In a linearly hardening plastic material, the true stress beyond initial yielding

Exam Year(s)

GATE ME - 2018,

Answer: A

The true stress increases linearly with the true strain.

A linear hardening (bilinear) material model has two straight segments: elastic loading up to yield, then a plastic segment of smaller but positive slope, the tangent or hardening modulus. Beyond yield the stress keeps rising in proportion to the plastic strain.

A constant stress after yield describes an elastic-perfectly plastic material, with no hardening. A decreasing stress would be softening, and "first increases then decreases" describes necking in an engineering stress-strain curve, not a linear hardening law.

Please log in or register to report this question.

Answer: B

UTS is the maximum load attained divided by the original cross-sectional area.

The ultimate tensile strength is an engineering stress: the highest point of the engineering stress-strain curve. Engineering stress always divides the load by the original area \(A_{0}\), so \(\text{UTS} = P_{max}/A_{0}\). After this point the specimen necks and the load falls.

The other definitions describe different quantities. The transition from elastic to plastic behaviour is the yield point (yield strength). The maximum load divided by the instantaneous area is the true stress at maximum load, which is higher than the UTS because the area has already shrunk. The stress at which the specimen breaks is the fracture (breaking) stress, which for a ductile metal lies below the UTS on the engineering curve.

Please log in or register to report this question.

8.

The stress ratio for a completely reversed cyclic loading during a fatigue test is

Exam Year(s)

GATE XE - 2018,

Answer: C

The stress ratio is -1.

The stress ratio is R = σmin/σmax. In completely reversed loading the stress swings between equal tensile and compressive values, σmin = -σmax, so R = -1 and the mean stress is zero.

R = 0 describes zero-to-tension (pulsating) loading, R = 1 a static load with no cycling, and -1/2 a cycle whose compressive peak is half the tensile peak.

Please log in or register to report this question.

9.

Which one of the following samples of high-purity aluminium (Al) single crystal will plastically yield at the lowest applied load under ambient conditions? Loading axis is along the direction shown in the schematic.

Exam Year(s)

GATE XE - 2022,

Answer: D

The sample loaded along [123], (iv), yields first.

Aluminium is FCC and slips on {111}\(\langle 110 \rangle\) systems. Yield begins when the resolved shear stress on the most favourable system reaches the critical value, \(\tau_{c} = \sigma\cos\phi\cos\lambda\), so the load needed is smallest for the orientation with the largest Schmid factor \(m = \cos\phi\cos\lambda\).

  • [100] and [101]: maximum m is about 0.41.
  • [111]: maximum m is about 0.27.
  • [123]: a single-slip orientation near the middle of the standard triangle, with m close to the ideal 0.5 (about 0.47).

So [123] needs the lowest load. [111] is the hardest orientation, and [100] and [101] lie in between.

Please log in or register to report this question.

10.

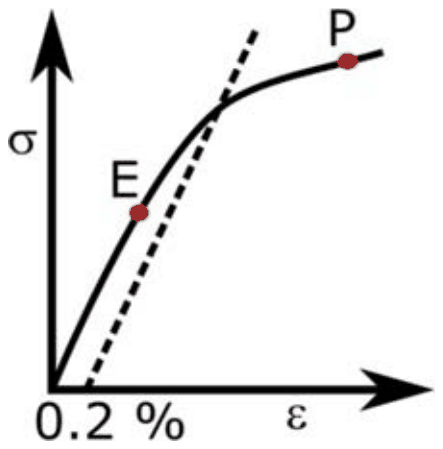
Refer to the schematic shown. Two dog-bone samples, labelled 1 and 2, of a Cu-alloy are tested under tension at room temperature to points “E” and “P”, respectively. Subsequently, they are unloaded completely and metallographically polished. Brinell hardness testing was performed in the gauge section of the samples. Which one of the following can be inferred about the measured Brinell hardness number (BHN)?

A stress-strain curve with point E on the initial linear part and point P beyond the 0.2 percent offset line, in the plastic region

Exam Year(s)

GATE XE - 2022,

Answer: C

The inference is BHN of 1 \(\lt\) BHN of 2.

Point E lies on the linear elastic part of the curve, so sample 1 recovers completely on unloading and its microstructure is unchanged. Point P lies beyond the 0.2% offset yield point, so sample 2 has deformed plastically: the dislocation density has risen and the alloy has work hardened. After unloading, sample 2 keeps that strain hardening and so shows a higher Brinell hardness.

Polishing removes only the surface, not the bulk work hardening, so equal hardness is wrong; and enough information is given, since the two points sit on opposite sides of yield.

Please log in or register to report this question.

Loading…
Tags: Mechanical Properties of Materials Questions and Answers || Mechanical Properties of Materials MCQ Questions and Answers || Mechanical Properties of Materials GK Questions and Answers || Mechanical Properties of Materials GK MCQ Questions || Mechanical Properties of Materials Multiple Choice Questions and Answers || Mechanical Properties of Materials GK || GK on Mechanical Properties of Materials || Materials Science Questions and Answers || Materials Science MCQ Questions and Answers || Materials Science GK Questions and Answers || GK on Materials Science