
Machine-translated by Google. Questions are authored in English.
Top

Interpretation of Data Questions and Answers

Direction for [ Question No: 11 To 14 ] :

Following table provides details about the Foreign Tourist Arrivals (FTAs) in India from different regions of the world in different years. Study the table carefully and answer questions based on this table.

RegionNumber of Foreign Tourist Arrivals
200720082009
Western Europe168608317995251610086
North America100727610272971024469
South Asia9824281051846982633
South East Asia303475332925348495
East Asia352037355230318292
West Asia171661215542201110
Total FTAs in India508150452826035108579

11.

Find out the region that contributed around 20 percent of the total foreign tourist arrivals in India in 2009.

Exam Year(s)

UGC NET - 2013,

Answer: B

North America contributed around 20 percent of the total foreign tourist arrivals in India in 2009. Its arrivals were 1,024,469 out of 5,108,579, which is about 20.05 percent.

Western Europe had 1,610,086, about 31.5 percent, South Asia had 982,633, about 19.2 percent, and South East Asia 348,495, about 6.8 percent. Of these, only North America is very close to 20 percent, so it is the answer.

Please log in or register to report this question.
12.

Which of the following regions has recorded the highest negative growth rate of foreign tourist arrivals in India in 2009 ?

Exam Year(s)

UGC NET - 2013,

Answer: A

Western Europe recorded the highest negative growth rate in 2009. Its arrivals fell from 1,799,525 to 1,610,086, a fall of about 10.5 percent.

South Asia fell by about 6.6 percent, West Asia by about 6.7 percent and North America only by about 0.3 percent. So among the four regions in the options, Western Europe has the largest decline.

Please log in or register to report this question.

13.

Find out the region that has been showing declining trend in terms of share of foreign tourist arrivals in India in 2008 and 2009.

Exam Year(s)

UGC NET - 2013,

Answer: C

East Asia has shown a declining trend in its share of total arrivals in both 2008 and 2009. Its share was about 6.93 percent in 2007, about 6.72 percent in 2008 and about 6.23 percent in 2009.

Western Europe's share rose in 2008 (from 33.2 to 34.1 percent) before falling in 2009, South East Asia's share rose in both years, and West Asia's share rose in 2008 and fell in 2009. Only East Asia fell in both years.

Please log in or register to report this question.

14.

Identify the region that has shown hyper growth rate of foreign tourist arrivals than the growth rate of the total FTAs in India in 2008.

Exam Year(s)

UGC NET - 2013,

Answer: C

Total arrivals grew by about 4.0 percent in 2008. South Asia grew by about 7.1 percent (982,428 to 1,051,846), the highest of the regions listed, and so it shows a hyper growth rate in relation to the total.

North America grew by about 2.0 percent and East Asia by about 0.9 percent, both below the total. Western Europe grew by about 6.7 percent, which is also above the total but lower than that of South Asia, so South Asia is the region with the clearly highest growth. A reviewer may note that Western Europe also beat the total.

Please log in or register to report this question.

Direction for [ Question No: 15 To 16 ] :

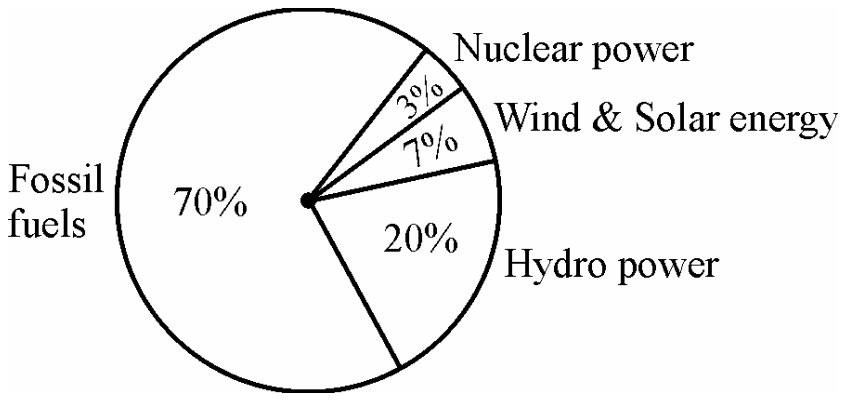
The total electricity generation in a country is 97 GW. The contribution of various energy sources is indicated in percentage terms in the Pie Chart given below ;

Pie chart of electricity generation by source: fossil fuels 70 per cent, hydro power 20 per cent, wind and solar energy 7 per cent, nuclear power 3 per cent.

15.

What is the contribution of wind and solar power in absolute terms in the electricity generation ?

Exam Year(s)

UGC NET - 2012,

Answer: A

The contribution of wind and solar power is 6.79 GW. From the pie chart, wind and solar energy supply 7 per cent of the total of 97 GW, so


\[ \frac{7}{100} \times 97 = 6.79\ \text{GW} \]

The value 9.7 GW is 10 per cent of the total, 19.4 GW is 20 per cent, which is the share of hydro power, and 29.1 GW is 30 per cent, so these come from reading the wrong sector or the wrong percentage. The answer is 6.79 GW.

Please log in or register to report this question.

16.

What is the contribution of renewable energy sources in absolute terms in the electricity generation ?

Exam Year(s)

UGC NET - 2012,

Answer: B

The contribution of the renewable sources is 26.19 GW. In the pie chart the renewable sources are hydro power at 20 per cent and wind and solar energy at 7 per cent, which together make 27 per cent of the 97 GW total:


\[ \frac{27}{100} \times 97 = 26.19\ \text{GW} \]

Nuclear power and fossil fuels are not renewable. The value 29.1 GW would be 30 per cent, which adds the 3 per cent of nuclear power, 67.9 GW is the share of fossil fuels at 70 per cent, and 97 GW is the whole generation. The answer is 26.19 GW.

Please log in or register to report this question.

Direction for [ Question No: 17 To 20 ] :

On the basis of the data given in the following table, give answers to questions :

Government Expenditures on Social Services (As percent of total expenditure)

Sl. No.Items2007-082008-092009-102010-11
Social Services11.0612.9413.0614.02
(a)Education, sports & youth affairs4.024.043.964.46
(b)Health & family welfare2.051.911.902.03
(c)Water supply, housing, etc.2.022.312.202.27
(d)Information & broadcasting0.220.220.200.22
(e)Welfare to SC/ST & OBC0.360.350.410.63
(f)Labour and employment0.270.270.220.25
(g)Social welfare & nutrition0.820.720.791.06
(h)North-eastern areas0.001.561.501.75
(i)Other social services1.291.551.871.34
Total Government expenditure100.00100.00100.00100.00

17.

How many activities in the social services are there where the expenditure has been less than 5 percent of the total expenditures incurred on the social services in 2008-09 ?

Exam Year(s)

UGC NET - 2012,

Answer: D

Each item in the table is given as a percentage of total government expenditure. The largest item, education, sports and youth affairs, is 4.04 in 2008-09, and every other item is smaller. So all nine items in the table are below 5 percent of total expenditure in 2008-09, which makes the answer 'all the above'. The choices of one, three or five activities each count only some items and ignore the others that also lie below 5.

Please log in or register to report this question.

18.

In which year, the expenditures on the social services have increased at the highest rate ?

Exam Year(s)

UGC NET - 2012,

Answer: B

Compare the total expenditure on social services from year to year: 11.06, 12.94, 13.06 and 14.02.

\[ 2008\text{-}09:\ 12.94-11.06=1.88 \]

\[ 2009\text{-}10:\ 13.06-12.94=0.12 \]

\[ 2010\text{-}11:\ 14.02-13.06=0.96 \]

The biggest rise, 1.88 points or about 17 percent, is in 2008-09. The answer is 2008-09. In percentage terms the rise in 2008-09 is about 17 percent, against about 1 percent in 2009-10 and about 7 percent in 2010-11.

Please log in or register to report this question.

19.

Which of the following activities remains almost stagnant in terms of share of expenditures ?

Exam Year(s)

UGC NET - 2012,

Answer: C

An item is stagnant if its share hardly changes. Information and broadcasting stays at 0.22, 0.22, 0.20 and 0.22 over the four years. North-eastern areas jumps from 0.00 to 1.56, welfare to SC/ST and OBC rises from 0.36 to 0.63, and social welfare and nutrition changes from 0.82 to 1.06. The answer is information and broadcasting. The share of information and broadcasting varies only between 0.20 and 0.22 over the four years, a spread of 0.02, while the others change by much more.

Please log in or register to report this question.

20.

Which of the following item's expenditure share is almost equal to the remaining three items in the given years ?

Exam Year(s)

UGC NET - 2012,

Answer: D

Add the three small items, information and broadcasting, welfare to SC/ST and OBC, and labour and employment, for each year and compare with social welfare and nutrition.

\[ 2007\text{-}08:\ 0.22+0.36+0.27=0.85\ (0.82) \]

\[ 2008\text{-}09:\ 0.22+0.35+0.27=0.84\ (0.72) \]

\[ 2009\text{-}10:\ 0.20+0.41+0.22=0.83\ (0.79) \]

\[ 2010\text{-}11:\ 0.22+0.63+0.25=1.10\ (1.06) \]

Social welfare and nutrition is within about 0.1 of the sum of the three in every year, so it is the item almost equal to the remaining three. The answer is social welfare and nutrition.

Please log in or register to report this question.

Loading…

Other Subjects

Tags: Interpretation of Data Questions and Answers