Machine-translated by Google. Questions are authored in English.
Top

Phase Diagrams Questions and Answers

1.

Fluidity of a molten alloy during sand casting depends on its solidification range. The phase diagram of a hypothetical binary alloy of components A and B is shown in the figure with its eutectic composition and temperature. All the lines in this phase diagram, including the solidus and liquidus lines, are straight lines. If this binary alloy with 15 weight % of B is poured into a mould at a pouring temperature of 800 °C, then the solidification range is
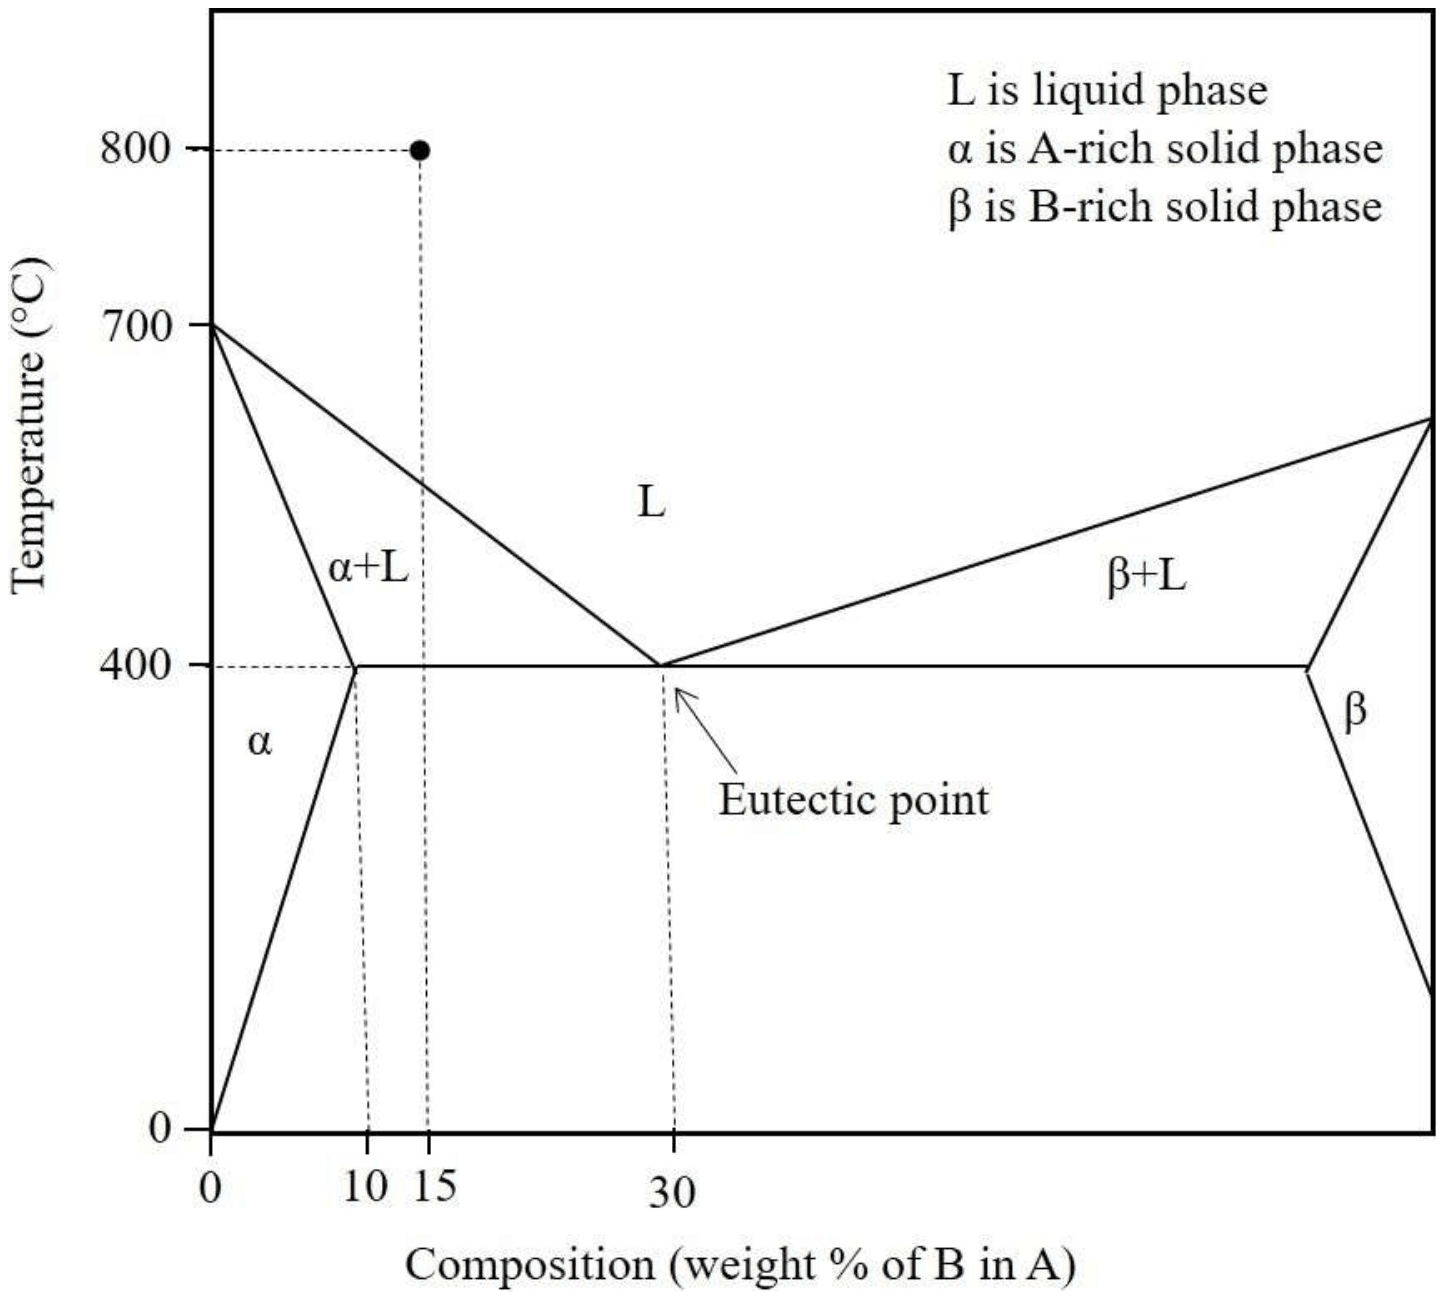
Phase diagram, temperature 0 to 800 degrees C against weight % of B. Liquidus falls in a straight line from 700 at 0 % to the eutectic at 30 % and 400; the alpha solidus runs from 700 at 0 % to 400 at 10 %. A dot marks 15 % at 800

Exam Year(s)

GATE ME - 2022,

Answer: D

The solidification range is 150 °C.

The solidification range is the temperature span between the start of freezing (the liquidus) and the end of freezing (the solidus) for the alloy's composition.

Liquidus at 15 % B. The liquidus is a straight line from 700 °C at 0 % to the eutectic at 400 °C and 30 %, falling 10 °C per 1 % B:

\[ T_{L} = 700 - 10 \times 15 = 550\ ^{\circ}\text{C} \]

Solidus at 15 % B. The alpha solidus ends at 10 % B on the eutectic line. An alloy richer than 10 % B finishes freezing at the eutectic temperature, 400 °C.

So the range is \(550 - 400 = 150\) °C. 250 °C is the superheat, 800 minus 550; 400 °C is the eutectic temperature itself; and 800 °C is the pouring temperature, which plays no part in the freezing range.

Please log in or register to report this question.
2.

Match the invariant reactions in Column I with the names in Column II (L is liquid phase, and α, β, γ are solid phases). All reactions proceed to the right on cooling.

Column IColumn II
(P) L ⇄ α + β(1) Monotectic
(Q) L + α ⇄ β(2) Peritectoid
(R) γ ⇄ α + β(3) Peritectic
(S) α + β ⇄ γ(4) Eutectoid
(5) Eutectic

Exam Year(s)

GATE XE - 2018,

Answer: B

The match is P-5, Q-3, R-4, S-2.

  • (P) L → α + β: a liquid gives two solids on cooling, the eutectic reaction.
  • (Q) L + α → β: a liquid and a solid combine into a new solid, the peritectic reaction.
  • (R) γ → α + β: the solid-state analogue of the eutectic, the eutectoid reaction (as in steel, austenite to ferrite and cementite).
  • (S) α + β → γ: two solids combine into one, the solid-state analogue of the peritectic, the peritectoid.

A monotectic is L1 → L2 + α, a liquid splitting into a second liquid and a solid, which matches none of the four reactions; options that use it for Q are therefore wrong.

Please log in or register to report this question.
3.

For a binary system at constant pressure, there are two types of invariant reactions:

(i) α ↔ β + γ
(ii) α + β ↔ γ

Analogously, how many different types of invariant reactions may exist under variable temperature and pressure, for a binary system?

Exam Year(s)

GATE XE - 2022,

Answer: C

There are 3 types.

The phase rule \(F = C - P + 2\) with C = 2 and both temperature and pressure free gives F = 0 for P = 4: an invariant point in a binary system then involves four phases. The ways one group of phases can turn into another are:

  • \(\alpha \leftrightarrow \beta + \gamma + \delta\)
  • \(\alpha + \beta \leftrightarrow \gamma + \delta\)
  • \(\alpha + \beta + \gamma \leftrightarrow \delta\)

That is three types, just as three phases at constant pressure give the two types in the stem. 2 is the constant-pressure count, and 1 and 4 do not match the ways of splitting four phases into two non-empty sides.

Please log in or register to report this question.
4.

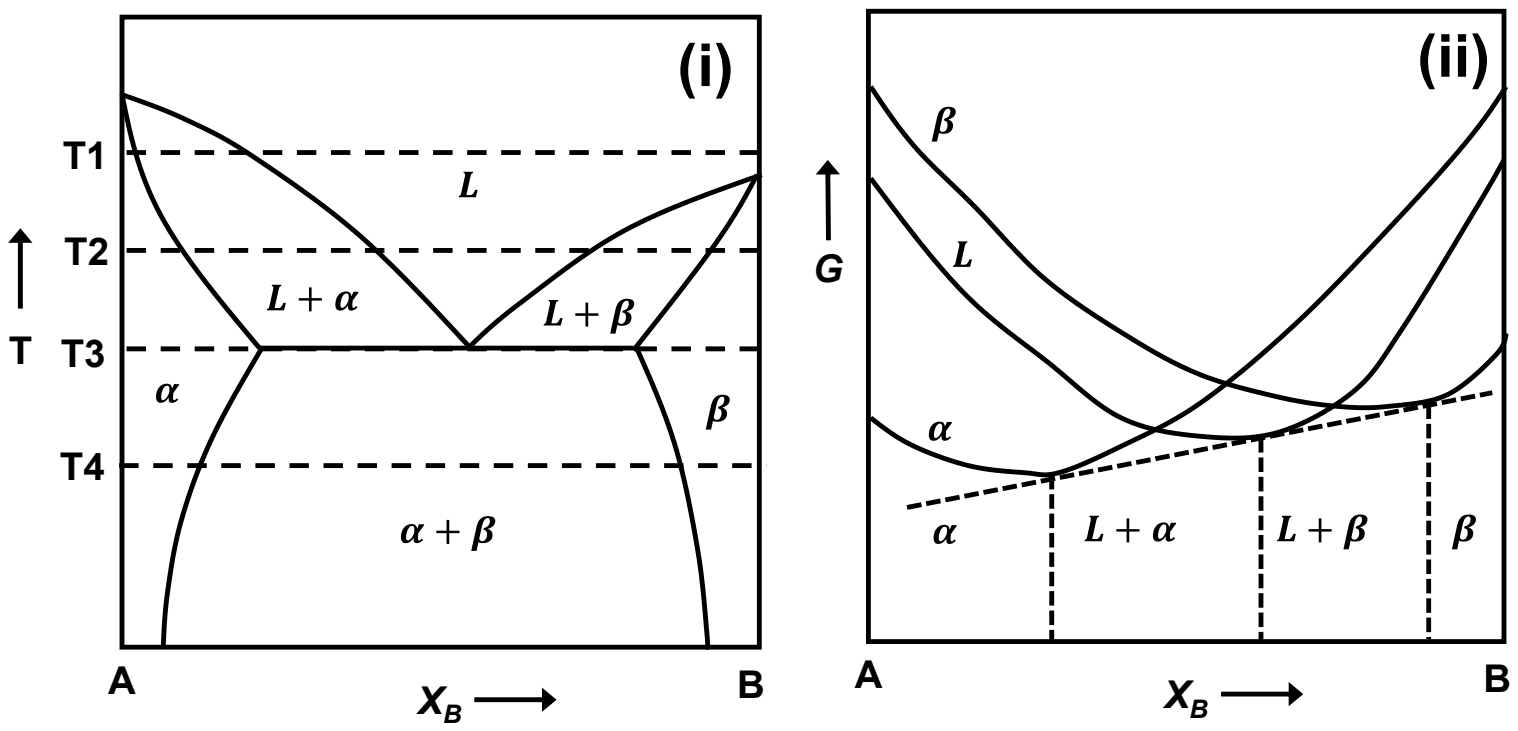
Figures (i) and (ii) show a binary phase diagram and the corresponding Gibbs free energy (\(G\)) vs. composition (\(X_{B}\)) diagram, respectively. Figure (ii) corresponds to which one of the temperatures shown in Figure (i)?

(i) A eutectic phase diagram of A and B with temperatures T1 to T4 marked, T3 at the eutectic line. (ii) Free energy curves of alpha, L and beta against composition, with a single dashed common tangent touching all three; regions labelled alpha, L plus alpha, L plus beta and beta

Exam Year(s)

GATE XE - 2023,

Answer: C

Figure (ii) corresponds to T3.

Equilibrium phases are found by common tangents to the free energy curves. In figure (ii) a single straight tangent touches the \(\alpha\), \(L\) and \(\beta\) curves at once, so three phases coexist in equilibrium. In a binary system at fixed pressure that happens only at the invariant eutectic temperature, which is T3 in figure (i).

At T1 the liquid curve would lie below both solid curves over most of the range. At T2 there would be two separate tangents, \(\alpha\)-\(L\) and \(L\)-\(\beta\), with a single-phase liquid range between them. At T4 the liquid curve would lie above everything, and a single tangent would join only \(\alpha\) and \(\beta\).

Please log in or register to report this question.
5.

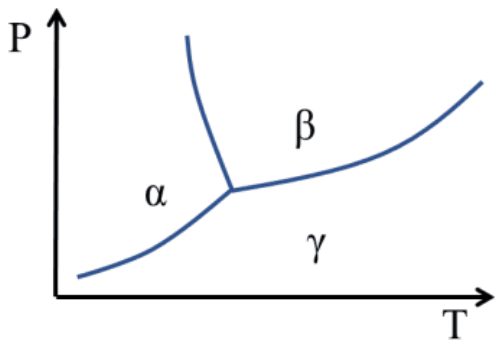
The correct combination of phases in the one-component H2O phase diagram, as given below, is

P-T phase diagram with three regions: alpha at low temperature and high pressure, beta at higher temperature and high pressure, gamma below both at low pressure, meeting at a triple point

Exam Year(s)

GATE XE - 2024,

Answer: B

The correct combination is α - ice; β - water; γ - vapour.

On a P-T diagram the solid occupies the low-temperature, high-pressure region (α), the liquid the higher-temperature, high-pressure region (β), and the vapour the low-pressure region below both (γ). The three boundaries meet at the triple point.

The diagram also shows water's anomaly: the ice-water boundary leans backwards (negative slope), because ice is less dense than water, so raising the pressure lowers the melting point. Every other assignment puts vapour at high pressure or ice at high temperature, which contradicts this layout.

Please log in or register to report this question.
6.

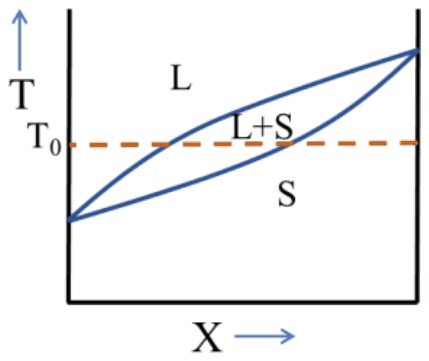
A binary phase diagram is given below.

Isomorphous binary phase diagram: liquidus and solidus rise from the left melting point to the higher right melting point, with L above, S below and L+S between; a dashed line marks temperature T0 across the two-phase lens

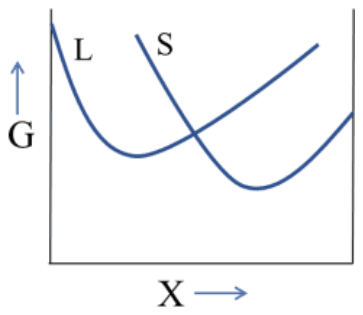
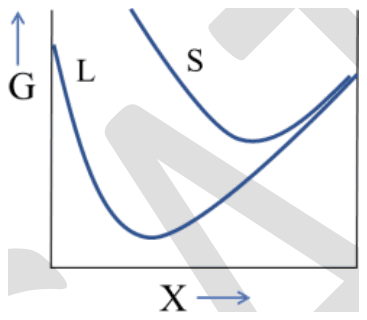
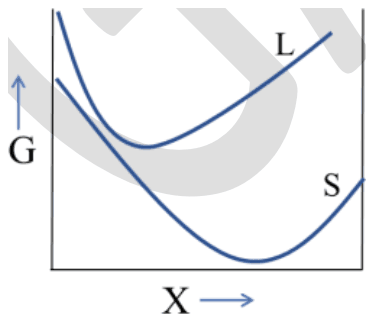
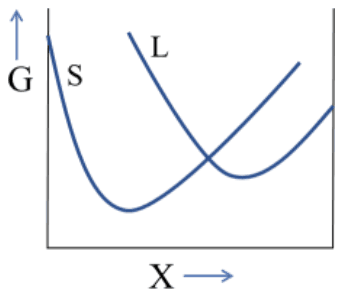
Which one of the following figures qualitatively represents the G-X (Gibbs free energy - composition) plot at temperature T0 shown in the phase diagram?

Exam Year(s)

GATE XE - 2024,

Answer: A

The correct G-X plot is (A).

The diagram is an isomorphous system, with liquidus and solidus rising from the lower-melting component on the left to the higher-melting one on the right. At \(T_0\), alloys near the left are liquid and those near the right are solid, with a two-phase L+S range between.

So the liquid free-energy curve must be lower on the left and the solid curve lower on the right, the two curves crossing so that a common tangent spans the L+S range. Plot (A) shows exactly this: the L curve's minimum on the left, the S curve's minimum on the right, and the curves crossing between them.

In (B) the liquid is lower everywhere, which would make every composition liquid at \(T_0\). In (C) the solid is lower over nearly all compositions. In (D) the roles are reversed, putting the solid on the low-melting side.

Please log in or register to report this question.
7.

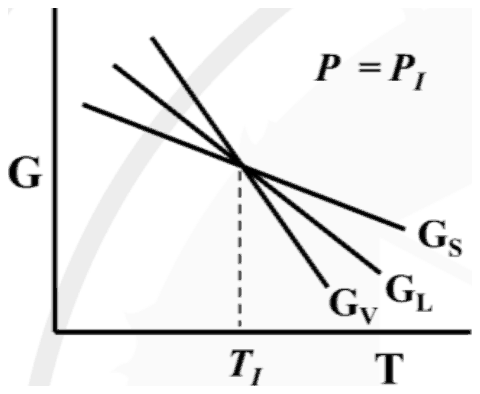
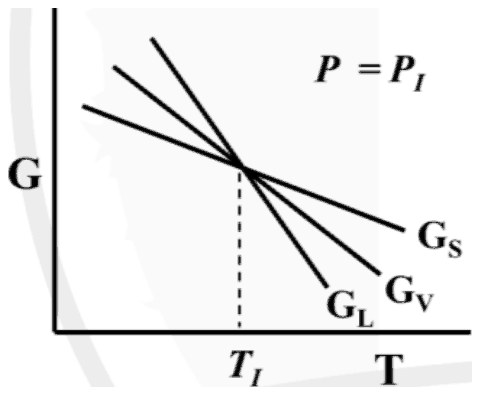
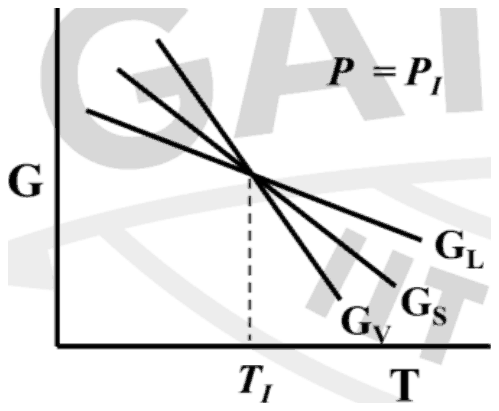
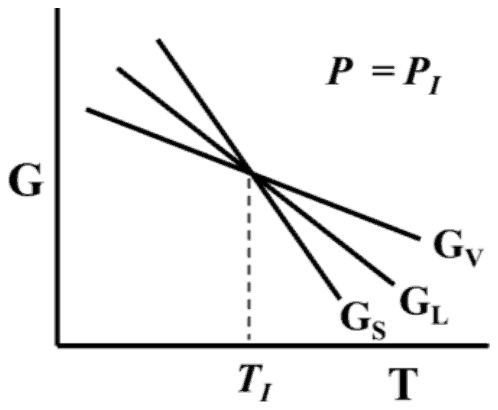
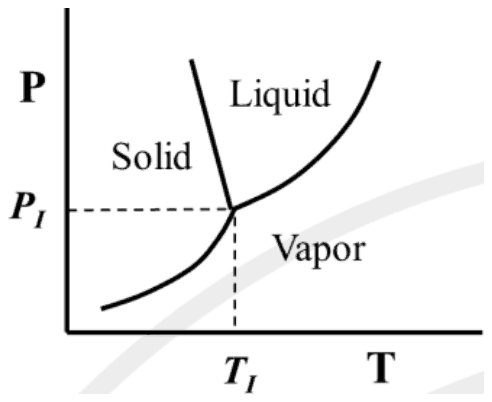
The triple point \((T_{I}, P_{I})\) is shown in a schematic phase diagram (pressure (P) - temperature (T) plot) for one component system. GS, GL and GV are the free energies of solid, liquid and vapor, respectively. At a constant pressure, \(P_{I}\), the correct free energy (G) versus temperature (T) plot is

Pressure-temperature phase diagram with solid, liquid and vapor regions meeting at the triple point TI, PI

Exam Year(s)

GATE XE - 2025,

Answer: A

The correct plot is (A): at \(T_{I}\) all three lines cross, with \(G_{V}\) steepest, \(G_{L}\) next and \(G_{S}\) shallowest.

At constant pressure \((\partial G/\partial T)_{P} = -S\), so each line falls with a slope equal to the phase's entropy. Vapor has the highest entropy, liquid less and solid the least: \(S_{V} \gt S_{L} \gt S_{S}\). At the triple point pressure all three phases coexist at \(T_{I}\), so their free energies are equal there and the three lines meet at one point.

As a check, plot (A) has the solid lowest below \(T_{I}\) and the vapor lowest above it, which matches the phase diagram along \(P = P_{I}\): solid below the triple point, vapor above. Plots (B), (C) and (D) give the liquid or the solid the steepest line, which would require a larger entropy than the vapor.

Please log in or register to report this question.
8.

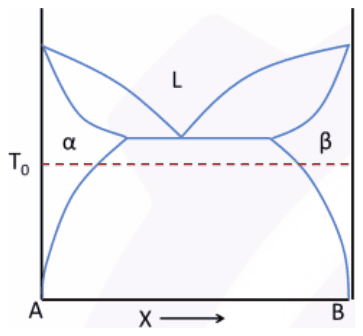
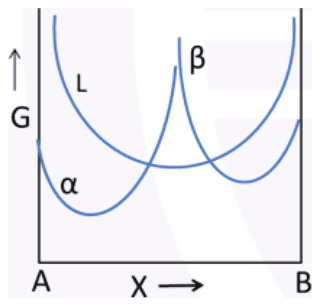
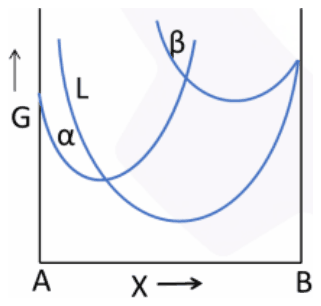
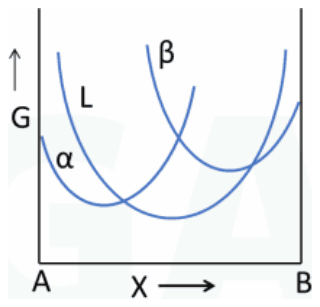
Three phases, α, β and L are shown in the binary phase diagram below. Identify the correct G - X (Gibbs free energy vs Composition) plot corresponding to temperature T0.

Eutectic phase diagram of A and B, phases alpha, beta and L; T0 lies below the eutectic, in the alpha plus beta field

Exam Year(s)

GATE XE - 2026,

Answer: A

The correct G - X plot is (A).

T0 lies below the eutectic temperature, where the equilibrium phases are α at the A-rich side, β at the B-rich side, and a two-phase α + β mixture between them. No liquid is stable at any composition.

In the free energy diagram this requires the α curve to have its minimum near A, the β curve its minimum near B, and the liquid curve to lie entirely above the common tangent drawn to the α and β curves. Plot (A) shows exactly this.

In (B) and (C) the liquid curve reaches below the solid curves, so liquid would be stable at intermediate compositions, which holds only above the eutectic temperature. (D) places the curves labelled β near A and α near B, the reverse of the phase diagram.

Please log in or register to report this question.
Loading…
Tags: Phase Diagrams Questions and Answers || Phase Diagrams MCQ Questions and Answers || Phase Diagrams GK Questions and Answers || Phase Diagrams GK MCQ Questions || Phase Diagrams Multiple Choice Questions and Answers || Phase Diagrams GK || GK on Phase Diagrams || Materials Science Questions and Answers || Materials Science MCQ Questions and Answers || Materials Science GK Questions and Answers || GK on Materials Science