
At \(T = 0\) K, which of the following diagram represents the occupation probability \(P(E)\) of energy states of electrons in a BCS type superconductor?
GATE Physics - 2022,
Answer: A
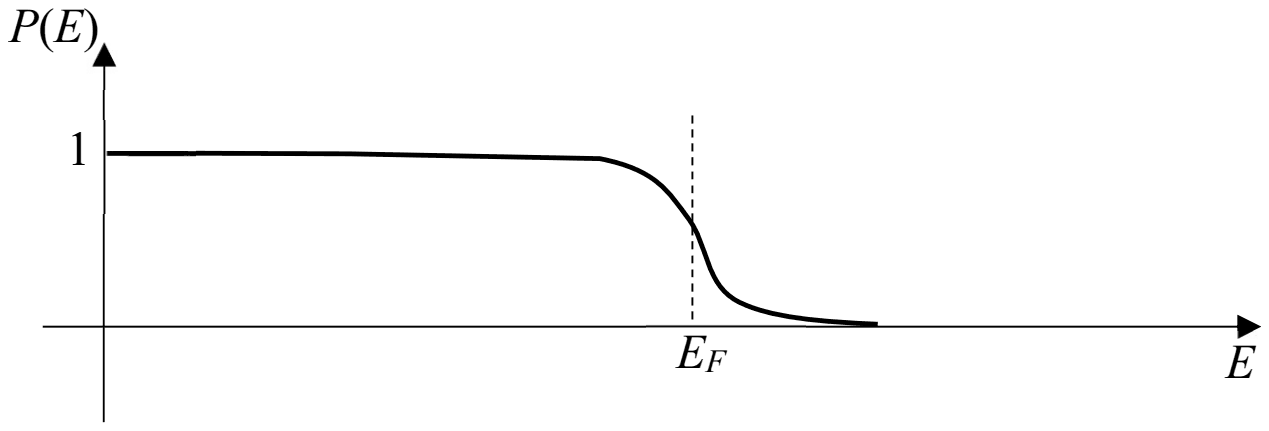
The correct diagram is (A): \(P(E)\) is 1 well below \(E_{F}\) and falls smoothly to 0 across \(E_{F}\).
In the BCS ground state, electrons pair up and the occupation of a state of energy \(\xi\) measured from \(E_{F}\) is
\[ \begin{aligned} v_{k}^{2} &= \frac{1}{2}\left(1 - \frac{\xi}{E}\right), \\ E &= \sqrt{\xi^{2} + \Delta^{2}} \end{aligned} \]
Even at \(T = 0\) this goes smoothly from 1 to 0 over an energy range of order the gap \(\Delta\), passing through \(\frac{1}{2}\) at \(E_{F}\). It looks like a Fermi function at finite temperature, though its origin is pairing, not thermal excitation.
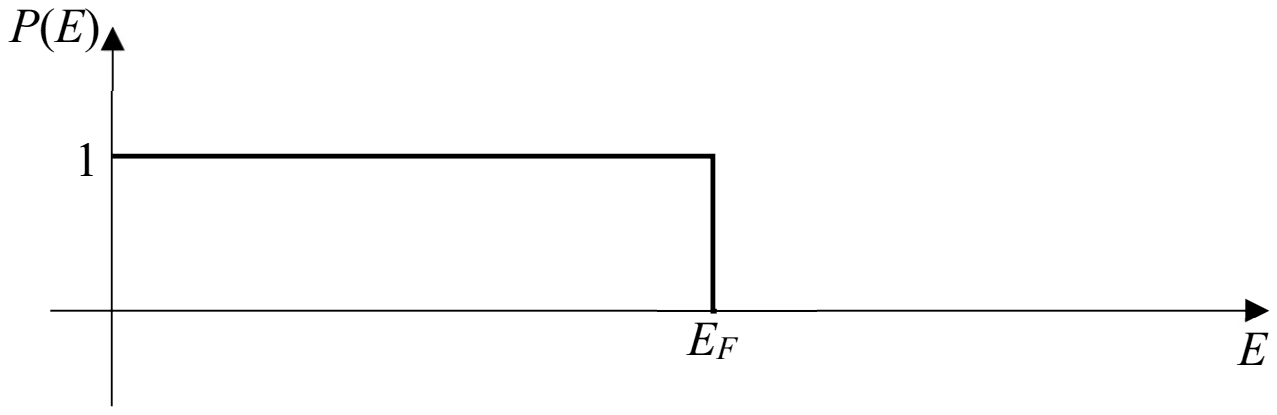
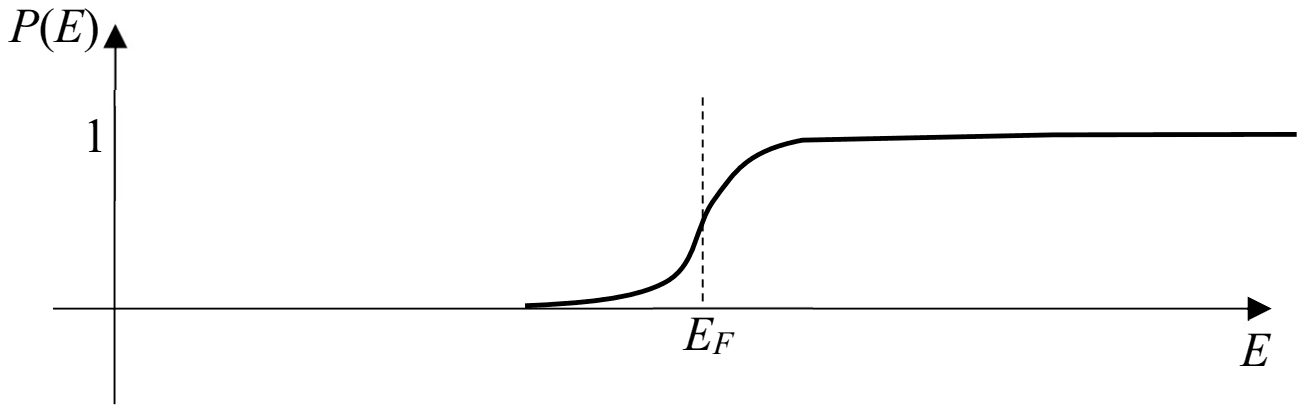
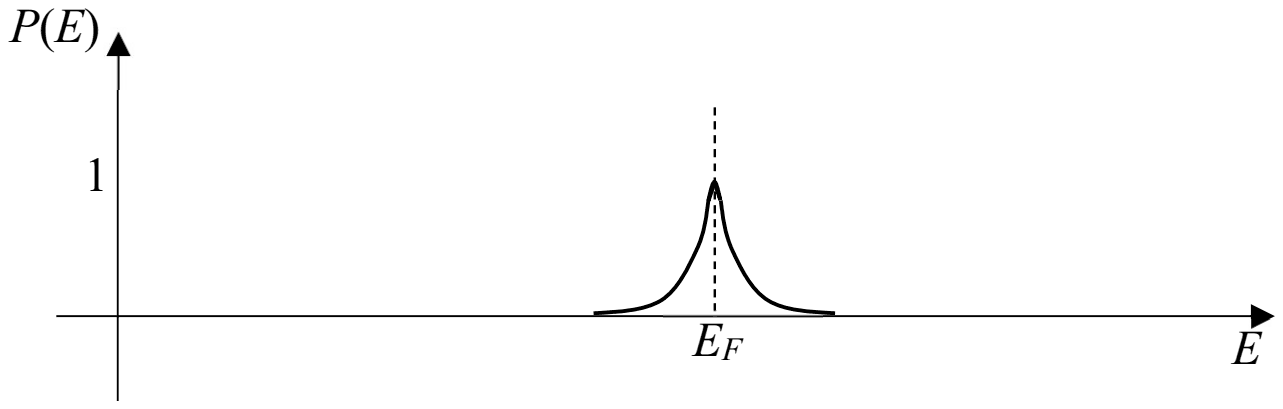
The sharp step (B) is a normal metal at \(T = 0\). The rising curve (C) is inverted, giving occupied states above \(E_{F}\) and empty ones below, and the peak (D) would leave deep states unoccupied.
Please log in or register to report this question.